St George Island Vacation Rental Investment Guide: What Buyers Need to Know in 2026
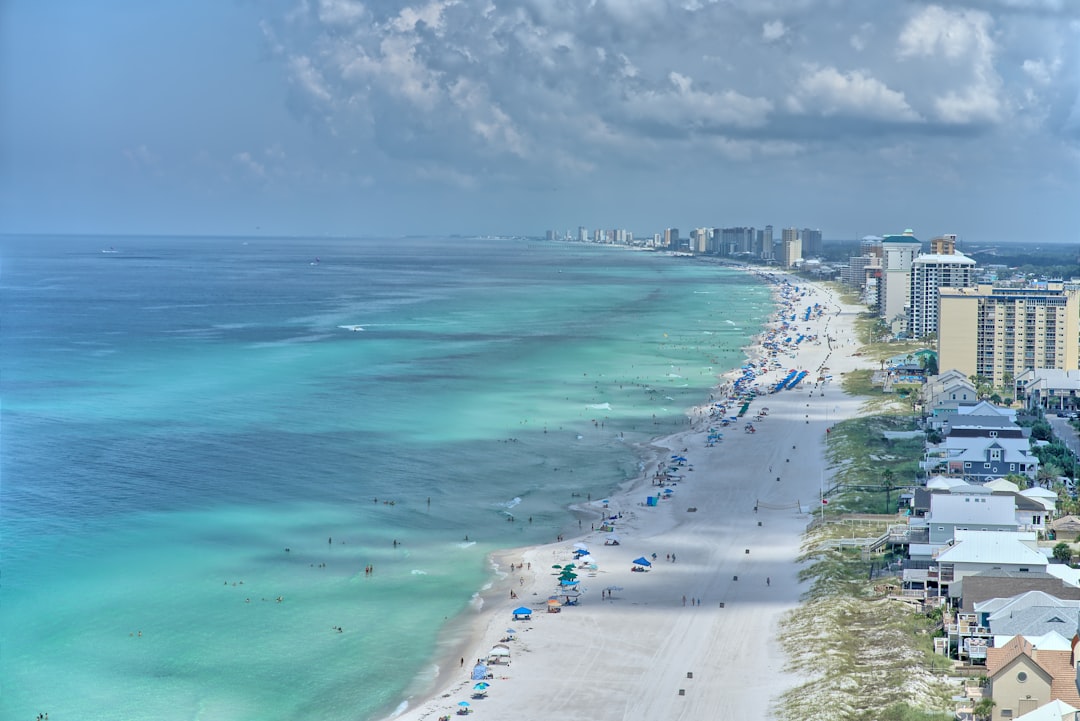
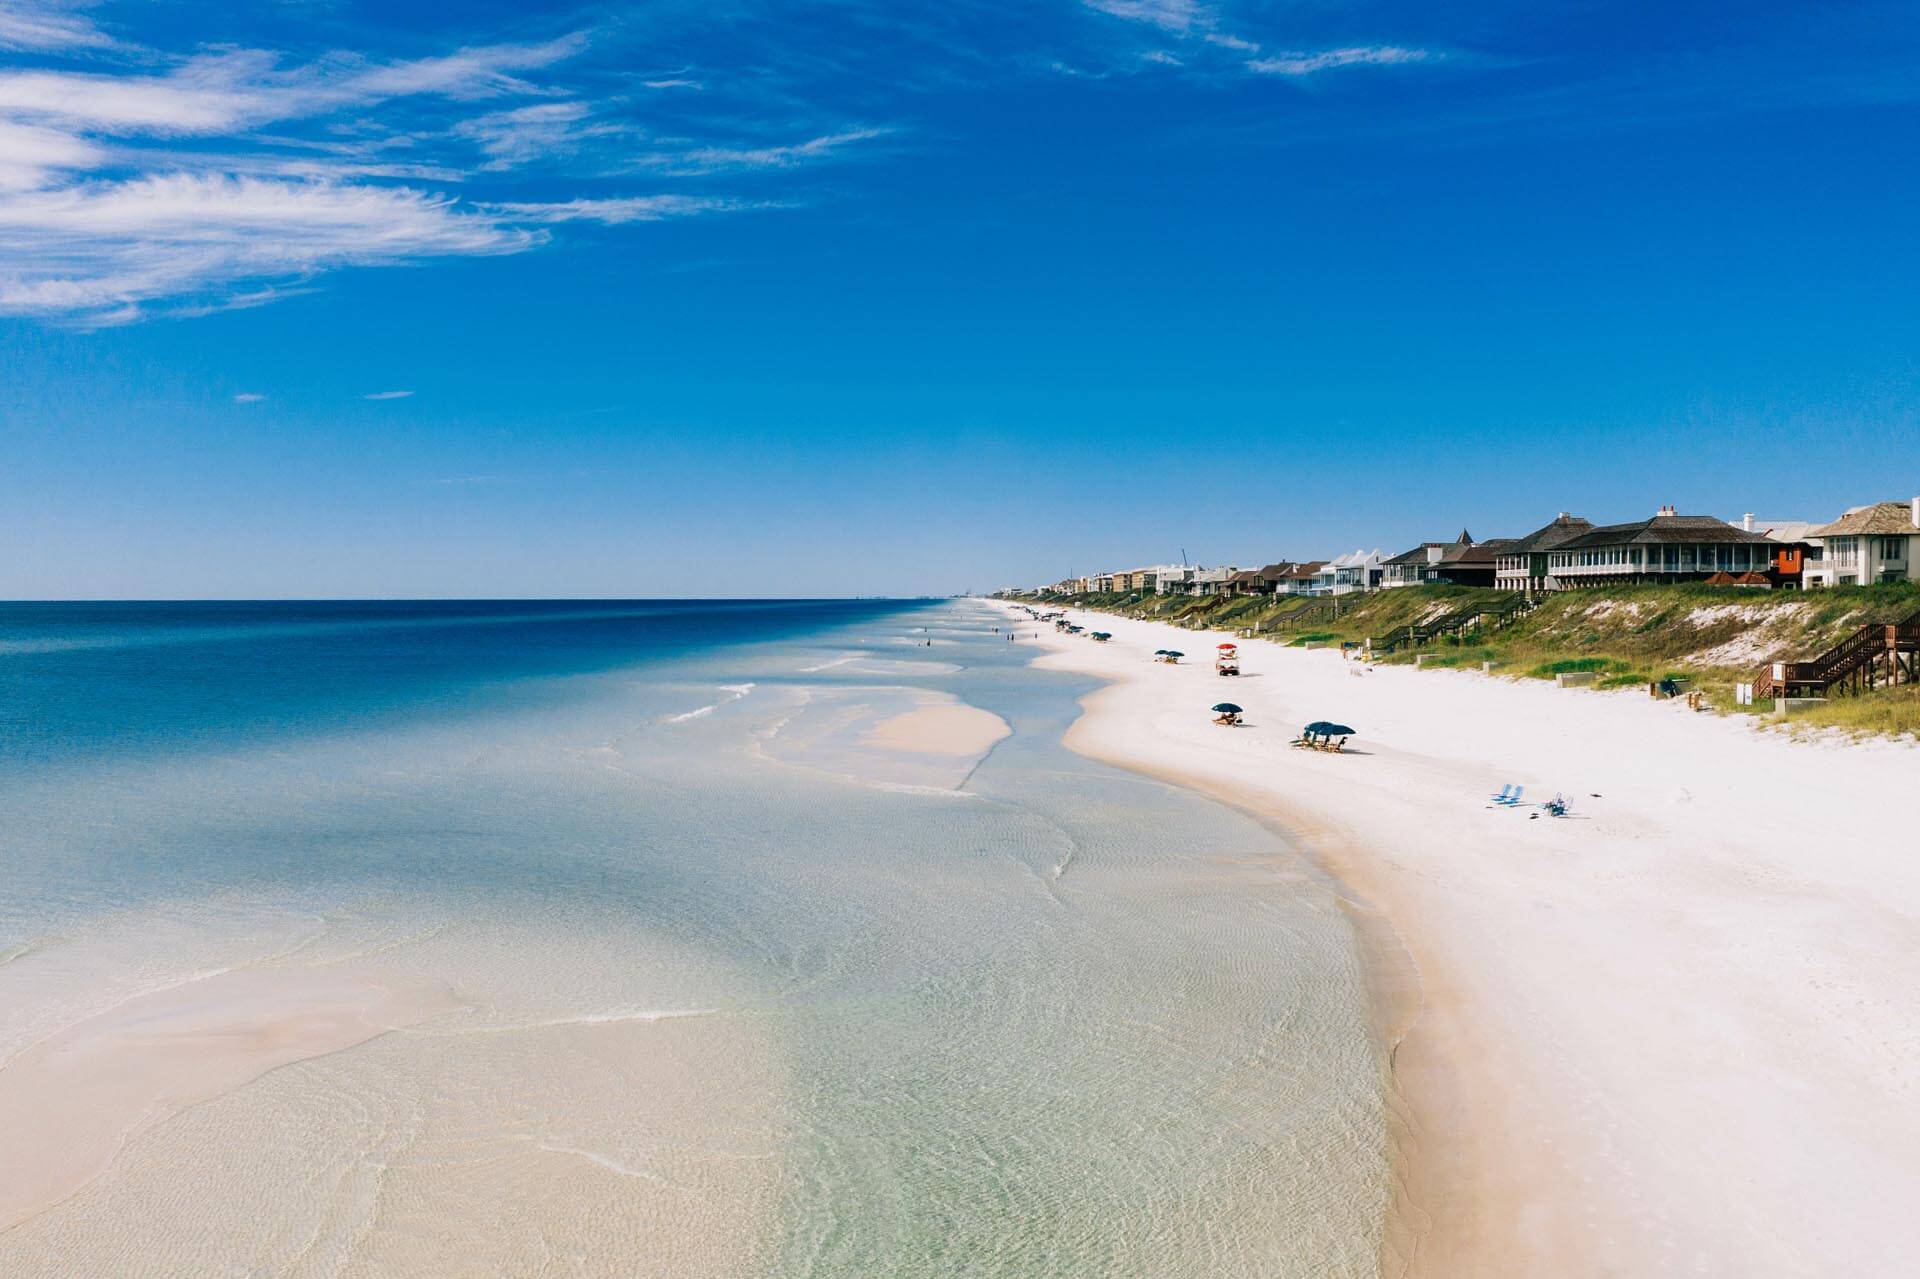
St George Island doesn’t look like most Florida beach towns — and that’s exactly the point. No high-rise condos. No chain restaurants stacked on top of each other. Just eight miles of undeveloped state park beach, quiet residential streets, and the kind of Gulf Coast atmosphere that disappeared from most of the Florida Panhandle twenty years ago. This st george island vacation rental investment guide breaks down everything buyers and investors need to know before purchasing in 2026 — the real numbers, the honest tradeoffs, and why right now may be one of the better entry windows this market has seen in several years.
Current Key Data market intelligence from our managed properties, pulled September 2026, shows ADR at $302.36 and adjusted paid occupancy at 45.3% — both down from last year. We’ll explain exactly what that means for buyers in a moment. The short version: when revenue metrics soften on a barrier island with finite land supply, that’s not a warning sign. That’s a buying window.
Why St George Island Attracts Serious Vacation Rental Investors
Before we get into the spreadsheet math, it helps to understand why St George Island commands the attention it does from serious Florida Panhandle vacation rental investors. This isn’t a market you stumble into. Buyers here are making a deliberate choice to pay a premium for something that can’t be replicated or mass-produced.
The Scarcity Factor — Barrier Island Supply Constraints
St George Island is a barrier island. That’s not a marketing phrase — it’s a geographic constraint that puts a hard ceiling on how many properties can ever exist here. Right now, active inventory sits at roughly 208 to 219 properties for sale, according to Perplexity research data. That’s the entire market. You’re not competing against unlimited suburban development or new construction sprawl. You’re competing for a slice of a genuinely limited asset class.
Median home prices on St George Island run $1.12M to $1.15M depending on the source and timing. That price reflects scarcity as much as it reflects square footage. Even during periods of price moderation — one dataset shows closed-sale medians down roughly 3% year over year — the structural floor is barrier island supply. Land doesn’t get created here. That supports long-term asset value even when short-term price cycles soften.
Old Florida Character Drives Premium Guest Demand
Guests who choose St George Island are not the same guests who book a Panama City Beach high-rise. They’re looking for something specific — low density, natural surroundings, and a beach experience that feels like Florida used to feel. That self-selection drives premium pricing that would look out of place on a market with more supply.
Perplexity research data shows peak-season occupancy hitting 61.9% during May through July, with an average daily rate of $566 per night and monthly revenue reaching approximately $10,147 during those months. That’s serious seasonal compression on a narrow inventory pool. During low season — December through February — occupancy drops to 31.2%, but ADR holds at $489 per night. Guests aren’t abandoning this market in the off-season because the price dropped. They’re staying because the experience holds value year-round.
This is a high-rate, moderate-occupancy market. Investors who underwrite St George Island vacation rental income expecting 70% annual occupancy will be disappointed. Investors who underwrite around 40% annual occupancy and model peak-season revenue compression as the primary income engine will find the numbers make sense.
Regional Policy Signals Support Long-Term Investor Confidence
Earlier this year, St George leadership completed a zoning overhaul that reduced 45 zoning districts down to 16. That simplification matters for investors. Clearer entitlement rules reduce regulatory uncertainty, make the development process more predictable, and help preserve the character of the island rather than allowing piecemeal zoning changes to erode what makes it valuable in the first place.
The city is also developing a 2050 Comprehensive Plan that maps out residential, commercial, infrastructure, and public works decisions across a 25-year horizon, with updates every three to five years. That level of structured planning signals managed, intentional growth — not unchecked development that would flood the market with inventory and undercut the scarcity premium. For long-term investors, guided growth is a feature, not a limitation.
St George Island Vacation Rental Market Data — What the Numbers Say Right Now
Let’s get into the actual numbers. We’re going to walk through current Key Data market intelligence from our managed properties first, then layer in broader market benchmarks for context. These two data sets together give you a realistic picture of where this market sits heading into the back half of 2026.
Current Performance Metrics From Our Managed Portfolio
Current Key Data market intelligence figures from our managed portfolio, as of September 2026:
Average Daily Rate: $302.36 — down 23.4% from last year. Buyers entering the market today are doing so at a point in the rate cycle that historically precedes recovery. When ADR compresses, it’s not permanent. It reflects normalization after an elevated post-pandemic cycle, and it creates a favorable acquisition entry point on both the real estate and revenue side simultaneously.
Adjusted Paid Occupancy: 45.3% — down 9.4% from last year. This still outperforms many of the broader market benchmarks we’ll reference below from Perplexity research data. There is meaningful upside here as demand normalizes through 2026 and into 2027.
RevPAR: $106.77 — this is your baseline for modeling net revenue per available rental night. It’s a useful stress-test number when you’re running conservative projections.
Average Booking Window: 44 days — guests are booking about six weeks in advance. That’s not a last-minute bargain-hunting pattern. That’s intentional trip planning from guests who know where they want to go and are committing to it in advance. That booking behavior supports rate stability.
Average Length of Stay: 5.2 nights — longer stays are good for owners. Fewer turnover cleans per month means lower cleaning costs, less wear on the property, and better net operating margins. A 5.2-night average is a genuinely favorable operational metric.
The current softness in ADR and occupancy reflects a normalization cycle, not a structural demand failure. The island didn’t change. The guests didn’t stop coming. The revenue cycle is adjusting after several years of elevated post-pandemic performance — which is exactly the kind of moment when disciplined buyers get in at the right price.
Broader Market Benchmarks for Context
For non-managed, market-wide context, Perplexity research data shows a market-wide ADR range of $490 to $545 per night on St George Island, with annual average revenue per listing coming in around $49,847. Market-wide occupancy runs approximately 36.6% to 45% depending on the dataset and sample period used.
Seasonal spread is wide. Peak season — May through July — produces occupancy of 61.9%, ADR of $566, and monthly revenue of roughly $10,147. Low season — December through February — produces occupancy of 31.2%, ADR of $489, and monthly revenue of approximately $3,894. June is the peak ADR month. February is the floor.
That seasonality profile tells you how to underwrite. If you’re building a pro forma, use 40% annual occupancy as your conservative stress-test baseline. If the deal works at 40% occupancy and $490 ADR, it works. If you need peak-season numbers to make the math function, you’re overextended.
What These Numbers Mean for Your Investment Underwriting
Using $49,847 as your gross annual revenue anchor from Perplexity research data, and modeling operating expenses at 30% to 40% of gross revenue — covering management fees, cleaning, maintenance, insurance, HOA where applicable, and property taxes — you’re looking at net operating income somewhere in the $30,000 to $35,000 range in a normalized year.
Against median home values of $1.12M to $1.15M, that puts inferred cap rates in roughly 3% to 5% gross territory before debt service. That is not a cash-flow-heavy investment at current price levels. This is a total return play — rental income plus long-term appreciation on a scarce, barrier island asset in a state with no income tax and strong structural demand for coastal real estate.
Two things move the needle materially above those averages: water access and view corridors. Gulf-front and direct-access properties outperform market averages on both ADR and occupancy. If your budget allows for a property with direct beach or bay access, the revenue profile shifts meaningfully in your favor.
Understanding the St George Island Real Estate Market in 2026
Current Pricing and Inventory Snapshot
Median sale prices on St George Island sit in the $1.12M to $1.15M range based on closed transactions, while active listing prices remain elevated — some sources show median asking prices above $1.2M in mid-2026. That gap between ask and closed is worth paying attention to. Perplexity research data shows homes selling at approximately 94% of list price, meaning the typical negotiation spread is around 6%. In a niche, high-ticket resort market with 85 to 122 days of average market time depending on the source, overpriced listings sit. Disciplined buyers who know the closed-sale data have real leverage.
Active inventory of 208 to 219 properties is contained enough that this market can move quickly when well-priced properties hit — but slow enough that buyers have time to be selective. That’s a healthier dynamic than the frenzied 2021 to 2022 environment, and it’s better for making sound investment decisions.
Buyer Considerations Before You Write an Offer
A few practical items that matter specifically for St George Island investment buyers:
Financing: At $1.1M and above, you’re in jumbo loan territory. That means tighter underwriting, larger reserve requirements, and stricter documentation if you’re using rental income to qualify. Get your lender aligned with investment property jumbo underwriting before you’re under contract.
Insurance: St George Island is a barrier island with meaningful wind and flood exposure. Insurance costs vary significantly by elevation, construction type, and claim history. There is no reliable island-wide average — budget for a site-specific insurance review as part of your due diligence, and do not skip this step. This line item can materially affect your net operating income projections.
HOA fees: These are highly community-specific on St George Island. Some subdivisions carry meaningful monthly dues; others are minimal. Verify HOA obligations for any specific property before you model cash flow.
Management quality: In a market where property quality and management execution drive revenue above or below the $49,847 average, who manages your property matters as much as where the property is located. Demand local expertise, local market knowledge, and transparent reporting.
Frequently Asked Questions
How much can a St George Island vacation rental realistically earn per year?
Perplexity research data puts average annual revenue at approximately $49,847 per listing across the St George Island market. Peak season — May through July — drives the bulk of that income, with monthly revenue around $10,147 during those months. Property quality, water access, and management execution push individual properties above or below that average. Underwrite conservatively at 40% annual occupancy and validate your assumptions with a local property manager who has actual market data — not just estimates.
Is St George Island a good time to buy in 2026?
Current Key Data market intelligence from our managed portfolio shows ADR down 23.4% and occupancy down 9.4% from last year as of September 2026. That softness reflects a normalization cycle after elevated post-pandemic demand — and it means buyers today are acquiring at a more favorable point on both the real estate price curve and the revenue cycle simultaneously. On a barrier island with finite inventory and structural guest demand, that combination doesn’t appear often. For disciplined buyers with realistic underwriting, the 2026 entry window looks favorable.
What are the biggest costs to budget for as an owner on St George Island?
Plan for property management fees, cleaning and turnover costs, routine maintenance, wind and flood insurance — which carries meaningful exposure on a barrier island and varies significantly by property — property taxes, and HOA fees where applicable. Model operating expenses at 30% to 40% of gross revenue for a conservative baseline. Insurance is the line item most buyers underestimate. Get a specific quote during due diligence, not after closing.
Does St George Island allow short-term rentals?
Short-term vacation rentals operate throughout St George Island, and it is an established vacation rental market with active property management infrastructure. That said, always verify current rental regulations, permitting requirements, and any community-specific restrictions for a specific property before closing. Rental regulations across Florida can change at the local level, and what applies island-wide may differ from what applies in a specific HOA or subdivision.
What should I look for in a St George Island property manager?
Look for a management company with an active portfolio on St George Island specifically — not just a Florida Panhandle presence. You want someone who can pull actual performance data for comparable properties on the island, not regional averages that lump St George Island in with Panama City Beach or 30A. Ask for their average ADR, occupancy rates, and booking window data for current managed properties. If they can’t answer those questions with specifics, keep looking.
Ready to Invest in St George Island?
Rent & Relax Vacation Rentals manages vacation rentals across St George Island and the broader Florida Panhandle — Panama City Beach, 30A, Mexico Beach, and Cape San Blas. We have actual performance data from actively managed properties, local market knowledge, and a straightforward approach to helping investors understand what a property can realistically produce before they buy it.
If you’re serious about a St George Island vacation rental investment, let’s sit down and run the numbers on a specific property. No pitch, no vague projections — just real data and honest analysis. Contact Rent & Relax Vacation Rentals today and ask to speak with our investment team. We’ll show you exactly what our managed properties are producing and help you figure out whether the deal in front of you makes sense.