St. George Island Investment Property Buyer Guide: What the 2026 Data Actually Shows
If you’ve been searching for a st george island investment property buyer guide that gives you straight numbers instead of hype, you’re in the right place. St. George Island sits at a genuinely interesting crossroads right now — a barrier island with structurally constrained supply, a loyal repeat-visitor base, and 2026 market metrics that have softened enough to create one of the more compelling buyer entry windows we’ve seen in several years along Florida’s Panhandle coast.
That said, conflicting data is everywhere. Portal medians swing by hundreds of thousands of dollars depending on the source. Year-over-year appreciation figures range from -6% to +37.7% depending on who you ask. This guide cuts through that noise using current Key Data market intelligence (October 2026 pull) from our Rent & Relax Vacation Rentals managed portfolio alongside independent market research sourced through Perplexity. One important caveat upfront: every st george island investment property performs differently. This guide sets realistic underwriting expectations — it does not guarantee any specific result.
Here’s what we’re covering: current market conditions, rental performance benchmarks, a cap-rate framework, and a practical buyer checklist. Let’s get into it.
Why St. George Island Attracts Real Estate Investors in 2026
Owning a st george island investment property is not the same as owning a vacation rental in Panama City Beach or even 30A. This market has a specific character, and understanding it determines whether the numbers work for you.
The Island’s Structural Scarcity Advantage
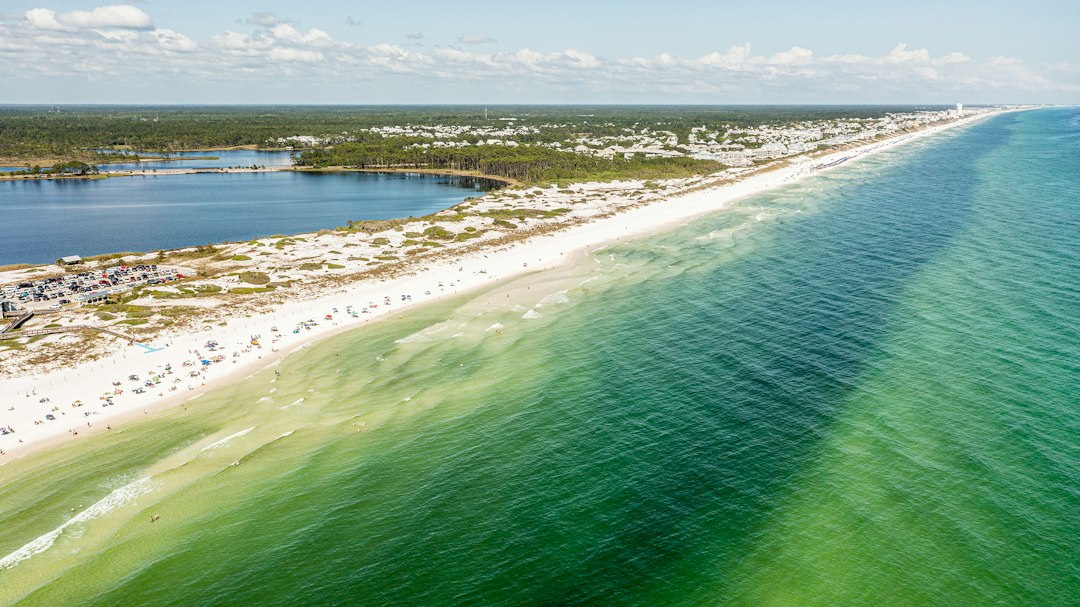
Dr. Julian G. Bruce St. George Island State Park protects roughly the eastern nine miles of the island. That’s not a minor detail — it’s a hard ceiling on future supply. No large resort development pipeline exists here. No high-rise condos are going up. The island is bridge-access only: one road in, one road out. That constraint is exactly why repeat visitors come back year after year, and it’s why the inventory you can buy today won’t be replicated by a developer two years from now.
Before you close, verify any pending Franklin County infrastructure projects — bridge condition, road improvements, sewer and water service, beach nourishment programs. Access reliability and utility stability are core to this investment thesis. Don’t assume a countywide project applies to the island without confirming it directly with county records.
Who Is Buying Here and Why
Three buyer profiles consistently show up in this market, and they underwrite deals differently.
Pure investment buyers are focused on yield — ADR, occupancy rate, net operating income. They’re running cap-rate math and want strong rental history from the seller. Personal use is minimal or zero.
Lifestyle-plus-income buyers are planning to use the property themselves 2–6 weeks per year and offset carrying costs with rental revenue. They’ll accept a slightly lower net yield in exchange for the personal use benefit. For this buyer, the 5.2-night average length of stay in our managed portfolio actually helps — longer stays mean fewer turnover weeks disrupting owner use blocks.
1031 exchange buyers are repositioning Florida coastal equity and often have a firm timeline. For this group, the current negotiation environment (more on that shortly) is particularly valuable — they can move quickly and negotiate hard, which matters when you’re working inside a 45-day identification window.
Regardless of which profile fits you, the 2026 market conditions favor the buyer side of the table. Here’s the data.
St. George Island Real Estate Market Conditions: What the Data Actually Shows
The st george island real estate market in 2026 looks very different depending on which portal you pull up. Understanding why those numbers diverge is just as important as knowing the numbers themselves.
Current Pricing and What the Median Really Means
Median sold prices range from approximately $935,000 to $1,212,500 depending on the source and measurement period (Realtor.com, Redfin, and Homes.com all show different figures). Active listing prices sit around $1.2 million.
Here’s the editorial warning you need: these medians are unreliable in isolation. St. George Island sees a relatively small number of transactions. One beachfront sale can move the median materially in either direction. More importantly, the 32328 ZIP code includes Eastpoint on the mainland — and that distortion is significant. One local report showed the ZIP-wide median dropping from $1.1 million to $664,900 as inventory rose from 103 to 261 listings between June 2025 and May 2026. That is not an island-only figure. Do not use it to underwrite an island purchase.
Conservative approach: anchor your comp analysis to island-specific closed sales with your buyer’s agent. Treat the $1.2 million active listing median as your starting negotiation reference, not your target purchase price.
Days on Market and Buyer Leverage
This is where 2026 gets interesting for buyers. Days on market runs approximately 117 to 155 days across sources, with local MLS commentary at 155 days as of August 2026. There are roughly 221 active listings with approximately 75 reported price reductions in the mid-2026 snapshot.
The sale-to-list ratio sits at approximately 94%. On a $1.2 million list price, that implies an indicative negotiated price near $1.13 million — before you factor in inspection findings, insurance cost discovery, and rental performance verification. Those are legitimate negotiating levers. Use them.
Properties are sitting. Sellers know it. If you walk into a negotiation with a clean pre-approval, a verified rental history review, and real insurance quotes in hand, you are in a strong position.
Year-Over-Year Price Trends and Why You Should Be Cautious
Year-over-year appreciation headlines range from +33.7% on Realtor.com to +37.7% on Redfin to -6% on Homes.com. All three numbers are technically defensible. All three are also misleading without context.
The statistical reason for the spread is thin transaction volume combined with mix shift. If more beachfront homes closed this period than last period, the median goes up — even if no individual home appreciated. The reverse is also true.
For underwriting purposes: model appreciation at 0–3% annually unless your buyer’s agent can support a higher figure with property-specific comps. Do not build your return thesis on the highest reported appreciation figure. Your return needs to work on cash flow alone, with appreciation as upside — not the other way around.
St. George Island Vacation Rental Performance: Reading the Numbers Correctly
St. George Island vacation rental investment underwriting requires two data layers: what the broader market shows, and what a professionally managed portfolio is actually producing. Here’s both.
Our Managed Portfolio Benchmarks (Key Data, October 2026)
These figures come from current Key Data market intelligence reflecting our Rent & Relax Vacation Rentals managed properties, October 2026 pull date. Use them as your baseline when stress-testing any property’s rental potential.
Average Daily Rate (ADR): $307.26 — down 20% from prior year. This is a buyer entry opportunity, not a red flag. You are underwriting at a trough. When ADR recovers toward prior-year levels, properties purchased at today’s prices capture that full upside. Buying at the peak of ADR and occupancy leaves no margin for error.
Adjusted Paid Occupancy: 42.9% — down 15.4% from prior year. Same framing applies. At 42.9% occupancy, our managed properties are still generating meaningful rental revenue. Buying into a softer occupancy environment means your upside case is supported by a market recovering toward prior highs rather than requiring performance above historical norms.
RevPAR: $104.45 — Revenue per Available Rental Day is the single most useful efficiency metric for comparing properties across price tiers. When you’re evaluating two properties with different ADR and occupancy profiles, RevPAR cuts through the noise. Use this as your baseline comparison tool.
Average Booking Window: 45 days — Guests are booking approximately six weeks out. This is important for two reasons. First, it affects how you structure cancellation policies — a longer window gives you more time to rebook a cancellation. Second, it tells you how far in advance to block owner-use weeks if you’re a lifestyle-plus-income buyer.
Average Length of Stay: 5.2 nights — Longer stays reduce cleaning frequency and the operating cost per revenue dollar. Fewer turnovers also means less wear on the property. This is a favorable operational characteristic, especially as some Florida coastal markets see minimum-stay ordinances push stays shorter.
For broader market context: independent market research shows St. George Island ADR benchmarks ranging from approximately $470 to $545 per night at the market level, with peak-season ADR commonly above $560 and top-decile properties reaching $911 or more per night. Peak-season occupancy runs approximately 61.9% (May through July being the clearest high-demand window), while winter occupancy drops to approximately 31.2%. Model these seasons separately — applying a blended annual rate underestimates summer and overestimates winter.
Building a Gross Revenue Model
Using independent market research figures at a $520 ADR, here’s a basic gross revenue sensitivity:
36.6% occupancy: approximately $69,500 annual gross revenue
41% occupancy: approximately $77,900 annual gross revenue
45% occupancy: approximately $85,400 annual gross revenue
None of these figures include cleaning charges, platform fees, management fees, maintenance, utilities, insurance, HOA dues, reserves, or owner-use adjustments. An illustrative operating-cost ratio of 40–55% of gross revenue is a reasonable starting range, which implies a net operating income somewhere between $31,000 and $51,000 annually before debt service.
At a $1.0 million acquisition price, that produces an indicative unlevered cap rate of approximately 3.1–5.1%. At $1.2 million, you’re looking at approximately 2.6–4.3%. These are underwriting estimates — not market-reported cap rates. A well-maintained beachfront home with a pool, elevator, and verified rental history can outperform this range. A poorly maintained inland property can underperform it significantly.
St. George Island Investment Property Buyer Checklist
Before you remove contingencies on any Florida Panhandle vacation rental property on St. George Island, work through this list.
Insurance: Get Real Quotes Before You Commit
Insurance is the single largest financial unknown in St. George Island underwriting. Do not use a generic Florida coastal estimate. A Gulf-front structure carries materially different risk — and cost — than a comparable home in a non-coastal market. Get property-specific quotes covering windstorm, flood (separate from your homeowner’s policy), hurricane deductibles, ordinance-and-law coverage, loss-of-rents coverage, and replacement-cost versus actual-cash-value terms. Roof age and elevation certificate status will drive your premium. Get these numbers before you’re under contract, not after.
HOA and Condo Due Diligence
No reliable island-wide HOA median exists in current public data. For any condo purchase, request the full resale package and current budget. Confirm monthly dues and recent increases, what the master windstorm policy covers versus what you cover individually, roof age and reserve funding, any pending special assessments, and — critically — whether the association permits short-term rentals and under what conditions. A low HOA fee today can be wiped out by a post-storm special assessment. Underwrite dues as a variable expense, not a fixed one.
Rental History Verification
Ask for documented rental history — not a projection sheet, not a pro forma from a management company. Actual booking records and channel statements from the prior 2–3 years. Compare that history against the Key Data benchmarks above. If a seller’s claimed revenue is materially above what the market is producing for comparable properties, ask why — and verify before you believe it.
Franklin County and Island-Specific Ordinance Check
Confirm current short-term rental registration requirements, any pending ordinance changes, beach nourishment project timelines, and the status of the bridge and road infrastructure. The island’s investment case is directly tied to access and beach condition. A regulatory change affecting rental eligibility or a major infrastructure disruption affects your revenue model immediately.
Frequently Asked Questions
What is a realistic cap rate for a St. George Island investment property in 2026?
Based on current market research, an indicative unlevered cap rate ranges from approximately 2.6% to 5.1% depending on purchase price, property type, and actual operating expenses. Beachfront homes with pools and strong rental history can outperform that range. Use property-specific rental history and real insurance quotes to build your own model — don’t rely on generic projections.
How much can a St. George Island vacation rental realistically generate per year?
At market-level benchmarks of $470–$545 ADR and 37–45% annual occupancy, gross annual revenue typically falls in the $69,500–$85,400 range before expenses. After management fees, insurance, HOA, maintenance, utilities, and reserves, net operating income commonly falls in the low-to-mid single digits as a yield on purchase price. Peak properties with documented rental history may perform above this range.
Is 2026 a good time to buy on St. George Island?
The data points toward yes — for a patient buyer who underwrites conservatively. Days on market are running 117–155 days. Sale-to-list ratios are at approximately 94%. ADR and occupancy in our managed portfolio are down from prior-year highs, which means you’re buying at a trough, not a peak. That’s a more favorable entry point than buying when every metric is at its high and sellers have leverage. That said, insurance costs, HOA exposure, and regulatory risk are real — verify all three before you close.
Why do St. George Island price reports vary so much between portals?
Transaction volume is low. When only a handful of properties close in a given period, one beachfront sale can swing the median by $200,000 or more. The 32328 ZIP code also includes Eastpoint on the mainland, and mixing those sales with island-only data produces meaningless medians. Always work with a buyer’s agent who can pull island-specific closed comparables — portal medians on St. George Island are a starting point, not an underwriting tool.
What is the biggest financial risk specific to St. George Island?
Insurance cost and availability, followed by HOA special assessment exposure for condo buyers. Gulf-front structures on a barrier island face windstorm and flood premiums that can significantly compress your net operating income. Get real quotes for the specific property before you remove your inspection contingency. A property that pencils at a generic Florida insurance rate may not pencil at the actual quote.
Ready to Invest in St. George Island?
We manage 100+ vacation rentals along Florida’s Emerald Coast, including properties on St. George Island. We know this market from the inside — the seasonal swings, the insurance landscape, the guest profiles, and the operational realities that don’t show up in a pro forma.
If you’re evaluating a St. George Island investment property and want to know what a property could realistically generate under professional management, talk to us before you make an offer. We’ll give you straight numbers based on current Key Data market intelligence from our own managed portfolio — not a best-case projection designed to get you to sign a management agreement.
Contact Rent & Relax Vacation Rentals to request a rental revenue analysis for any property you’re considering on St. George Island. No obligation, no sales pitch — just the data you need to make a smart decision.