St George Island Vacation Rental Market Trends 2027: What the Data Says Before You Buy
If you’ve been watching the st george island vacation rental market trends 2027 and waiting for the right moment to move — this might be it. Not because the numbers are screaming bullish. They’re not. But because the investors who make real money in markets like this one aren’t chasing momentum. They’re spotting windows. And right now, St. George Island is showing every classic signal of a buyer’s window: longer days on market, inventory up, sellers discounting from asking, and rental metrics that have softened enough to make purchase prices negotiable.
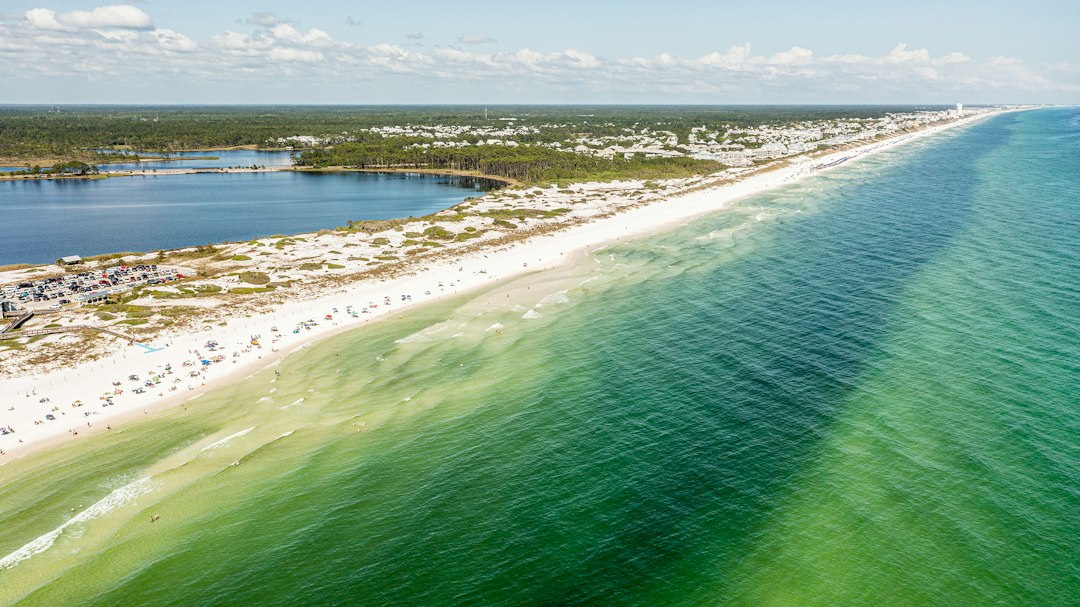
This is a barrier island with 22 miles of Gulf-front beach, roughly 60% of the island locked inside Dr. Julian G. Bruce St. George Island State Park, and no realistic path to mass development. The supply of buildable land isn’t growing. That structural scarcity is the long-game argument. The short-game argument is the data we’re walking through below.
All figures here should be treated as benchmarks for underwriting — not income guarantees. Property-specific performance depends on size, location, quality tier, amenities, and management. With that said, let’s get into the numbers.
What the Numbers Actually Show — St George Island Rental Performance Heading Into 2027
The st george island vacation rental market trends 2027 story starts with the Key Data dashboard. According to current Key Data market intelligence pulled from our managed portfolio in October 2026, here’s where performance benchmarks stand right now.
Key Data Dashboard Snapshot — Our Managed Portfolio, October 2026
| Metric | Current Figure | Year-Over-Year |
|---|---|---|
| Average Daily Rate (ADR) | $307.24 | Down 20% — favorable buyer entry point |
| Adjusted Paid Occupancy | 42.9% | Down 15.4% — market entry signal |
| RevPAR | $104.43 | Core revenue anchor for gross modeling |
| Average Booking Window | 45 days in advance | Critical for dynamic pricing strategy |
| Average Length of Stay | 5.2 nights | Favorable for turnover cost management |
Yes, ADR is down 20% and occupancy is down 15.4% from prior year across our managed properties. Here’s the honest read on that: softening rental metrics compress the income story sellers can tell, which puts downward pressure on what they can reasonably ask. That’s negotiating leverage for buyers. Properties that were listed based on 2024 or early 2025 peak-performance projections are now sitting longer. Sellers feel that. Smart buyers use it.
The 5.2-night average length of stay from our managed portfolio is worth calling out specifically. Longer stays mean fewer turnover cleans, lower per-night housekeeping costs, and more stable weekly revenue blocks. For a vacation rental operator trying to protect margins when ADR has come off its highs, that booking pattern is genuinely helpful.
How Our Managed Portfolio Compares to Market-Wide Benchmarks
For broader context, Perplexity research on non-managed market-wide St. George Island properties shows an ADR range of approximately $490–$545 per night, annual revenue per listing of roughly $49,847, and annual occupancy ranging from approximately 36.6% to 45%.
Our managed portfolio ADR of $307.24 reflects a different cross-section of property types, sizes, and quality tiers — this is not an apples-to-apples comparison with market-wide luxury beachfront benchmarks. Use the market-wide figures as your underwriting ceiling and our managed portfolio figures as a more conservative operating baseline when you’re running your own pro forma. The truth for most properties will land somewhere in between, depending on what you buy and how you manage it.
Seasonal Demand Patterns — When St George Island Vacation Rentals Perform Best
Understanding the seasonality of st george island vacation rentals is non-negotiable before you underwrite any deal here. The island runs on tourism, and that tourism is heavily concentrated in a three-month window.
Peak Season Breakdown — May Through July
Based on Perplexity market-wide research for non-managed properties, peak season on St. George Island runs May through July and produces the following benchmarks:
- Peak occupancy: approximately 61.9%
- Peak ADR: approximately $566 per night
- Peak monthly gross revenue: approximately $10,147
What drives it? School calendars. Gulf water temperatures that hit the mid-80s by June. Drive-market proximity — Atlanta is about six hours, Jacksonville is three, Tampa is four and a half. Families with kids book the island for full weeks because there’s nothing else to do but be on the beach, and that’s exactly what they came for. No Walmart, no outlet mall, no theme park competition.
Within that peak window, performance separation is real. Beachfront-access properties, private pools, updated interiors, and higher sleeping capacity consistently outperform comparables without those features — even during the weeks when everything rents. If you’re evaluating a specific property, find out exactly where it sits on that quality spectrum before you build your revenue model.
Shoulder Season and Low Season — What Investors Should Underwrite
Don’t build your investment case on peak weeks alone. Sophisticated buyers run the full twelve-month model. Here’s the honest picture:
Shoulder demand — spring break, late August, Labor Day weekend, Thanksgiving week — can support solid bookings, especially for larger homes with pools. These windows are manageable and important for annual yield.
Low season (December through February) is a different story. Market-wide Perplexity research benchmarks show approximately 31.2% occupancy and approximately $489 ADR during winter months. That’s not a disaster, but it’s not driving your annual return either. A property that clears $10,000 in July can sit at under $4,000 in January. Your annual math has to account for that full arc.
The investors who get burned on St. George Island are almost always the ones who annualized their July numbers. The investors who do well are the ones who modeled December honestly and bought at a price that still penciled out.
Booking Window and Length-of-Stay Implications for 2027 Revenue Planning
The 45-day average booking window from our managed portfolio October 2026 Key Data pull tells you something important about how guests are behaving right now. They’re not booking five or six months out. They’re deciding 30 to 60 days in advance. That means the pricing decisions you or your property manager make in that window matter enormously. Static pricing strategies miss real money. Dynamic pricing tools that adjust rates based on real-time demand signals — and hold firm on value dates rather than dropping prematurely — are the difference between capturing that late-decision demand and giving revenue away.
The 5.2-night average length of stay reinforces the weekly-booking structure that makes St. George Island operationally efficient. Fewer checkout-to-checkin turnovers per month means lower cleaning costs and less wear on the property. That’s a real number that improves your net operating position even if ADR is flat.
St George Island Real Estate Sales Market — Where Buyers Stand in 2027
The sales market picture on St. George Island real estate right now is as buyer-friendly as it’s been in several years. Here’s the data.
Pricing, Inventory, and Days on Market — The Data Buyers Need
Based on Perplexity research from multiple sources covering 2026 data:
- Median sale price: Approximately $1.15 million to $1.25 million, with different sources reporting $1.1525M, $1.2M, and $1.249M depending on the sample period
- Days on market: Approximately 117 to 155 days across Realtor.com, Redfin, and local MLS data — call it four to five months
- Sale-to-list discount: Approximately 6% to 7% below asking price
- Active inventory: Approximately 113 to 221 listings depending on the snapshot and date
- Price per square foot: Approximately $557 to $575
Read that combination of signals clearly. Sellers are sitting on listings for four-plus months and accepting 6–7% below asking when they finally close. On a $1.2 million property, a 7% discount is $84,000 off the table. That’s real money, and it’s available to buyers who come in prepared with clean offers and reasonable inspection contingencies.
One local mid-2026 report also noted zero foreclosures or short sales in its snapshot. This isn’t a distressed market. It’s a market where motivated sellers who priced optimistically are now facing reality. That’s a much better buying environment than a distressed one, because the properties you’re competing for aren’t damaged goods — they’re solid assets being sold by owners who misjudged the market.
Investment Yield Math — Running the Numbers at Today’s Prices
Using the Perplexity market-wide annual revenue benchmark of approximately $49,847 per listing, here’s a quick gross yield table across common St. George Island price points:
| Purchase Price | Gross Rental Yield |
|---|---|
| $800,000 | 6.2% |
| $1,000,000 | 5.0% |
| $1,200,000 | 4.2% |
| $1,500,000 | 3.3% |
These are gross yields — before management fees, cleaning, repairs, utilities, property taxes, insurance, HOA dues, reserves, and financing. A reasonable preliminary cap rate range for a stabilized St. George Island vacation rental is approximately 2.5% to 4.5% depending on all those factors. Insurance alone on a Gulf-front Florida property can be a five-figure annual line item. Get actual insurance quotes before you close, not estimates.
The entry price point matters here more than almost any other variable. A buyer who negotiates a $1.2 million property down to $1.1 million — well within the documented 6–7% discount range — has immediately improved their yield by nearly a full percentage point before they manage a single booking.
What to Verify Before You Make an Offer
St. George Island has some due diligence requirements that are more involved than a typical Florida purchase. Before you make an offer, get your hands on:
- Current HOA dues, three-year dues history, and any pending or expected special assessments
- Reserve study — underfunded reserves on a Gulf-front property are a ticking clock
- Master insurance declarations including wind and flood deductibles
- Rental restrictions: minimum stays, blackout periods, occupancy caps
- Property-specific windstorm, flood, and loss-of-rents insurance quotes — not the seller’s existing policy, your own quotes
- Actual rental history, not projected income from a seller’s marketing sheet
Insurance is where buyers get surprised on St. George Island. The island sits in Franklin County in a high-wind, high-flood-risk zone. A property that looks like it cash flows at 5% gross yield can drop to break-even or below once you add up wind, flood, liability, and loss-of-rents coverage at current market rates. Do this homework before you’re under contract, not after.
Frequently Asked Questions
What is the average rental income for a St. George Island vacation rental?
Based on Perplexity market-wide research for non-managed properties, the annual revenue benchmark is approximately $49,847 per listing. Performance varies significantly based on property size, beachfront access, pool availability, sleeping capacity, and management quality. Peak-season monthly gross revenue for well-positioned properties benchmarks around $10,147 during May through July. Always request actual rental history from the seller — not pro forma projections — as part of your due diligence.
Is St. George Island a good place to buy a vacation rental investment in 2027?
The current market conditions — longer days on market averaging 117 to 155 days, seller discounts of 6–7% below asking, and softened rental metrics — create a more favorable buyer entry point than St. George Island has seen in several years. The island’s limited developable land and state park buffers support long-term scarcity value. The investment case is strongest for buyers who underwrite conservatively across all twelve months, account fully for insurance and HOA costs, and negotiate acquisition price aggressively given current market conditions.
What are the occupancy rates on St. George Island?
According to current Key Data market intelligence from our managed portfolio pulled in October 2026, adjusted paid occupancy across our managed St. George Island properties sits at 42.9%. Market-wide Perplexity research shows annual occupancy ranging from approximately 36.6% to 45%, with peak season (May through July) reaching approximately 61.9% and low season (December through February) dropping to approximately 31.2%.
How long does it take to sell a property on St. George Island?
Current data from multiple sources shows days on market averaging approximately 117 to 155 days — roughly four to five months. That’s a meaningful shift from the faster-moving market of 2023 and early 2024, and it gives buyers more time to negotiate, conduct thorough due diligence, and avoid the pressure of competitive bidding. For buyers, this is one of the most favorable signals in the current market.
What should I budget for insurance on a St. George Island vacation rental?
Insurance costs vary significantly by property age, construction type, flood zone designation, elevation, and coverage structure. St. George Island sits in a high-wind, high-flood-risk coastal zone, and insurance is consistently one of the largest line items for island property owners. Before you make an offer, obtain actual quotes for windstorm, flood, liability, loss-of-rents, and ordinance-or-law coverage. Do not rely on the seller’s existing policy or any estimate — get your own numbers from a licensed Florida coastal insurance broker.
Ready to Invest in St. George Island?
Rent & Relax Vacation Rentals manages 100+ properties across Florida’s Emerald Coast, including St. George Island. We run Key Data market intelligence on our managed portfolio every month, and we work directly with buyers who want real performance data — not marketing projections — before they pull the trigger on a purchase.
If you’re evaluating a specific property on St. George Island and want to know how it compares to actual managed-portfolio benchmarks, or if you want to talk through what professional management looks like for a property you’re considering, reach out to us directly. We’ll give you the straight numbers and help you underwrite the deal the right way — before you’re under contract, not after.
Contact Rent & Relax Vacation Rentals today to get property-specific rental data and find out what your St. George Island investment could actually produce under professional management.