Cape San Blas Best Family-Oriented Investment Areas: A Complete Guide for Buyers and Investors in 2026
If you’re searching for the cape san blas best family-oriented investment areas, you’ve landed in the right place. Cape San Blas — a narrow barrier peninsula stretching south into the Gulf off Gulf County in Florida’s Panhandle — is quietly one of the most compelling family vacation rental investment opportunities on the entire Gulf Coast right now. No high-rises. No strip malls. No spring break chaos. Just wide, uncrowded beaches, low-density zoning, and a drivable location that pulls families from Atlanta, Birmingham, Nashville, and Tampa year after year. And in 2026, with prices off their 2024 peak and days on market stretching past 100 days in many sub-segments, buyers finally have time to think. That’s a structural advantage — and this guide breaks down exactly how to use it.
We’ll cover current real estate prices, what short-term rental income actually looks like based on current Key Data market intelligence from our managed properties, the specific areas and property types that perform best for family renters, and how to underwrite a realistic purchase in today’s market. Let’s get into it.
Why Cape San Blas Is One of Florida’s Top Family-Oriented Investment Markets in 2026
The cape san blas best family-oriented investment areas discussion starts with understanding why this peninsula is fundamentally different from the rest of the Florida Panhandle — and why that difference matters for your investment thesis.
The Case for Low-Density, Family-Focused Beach Markets
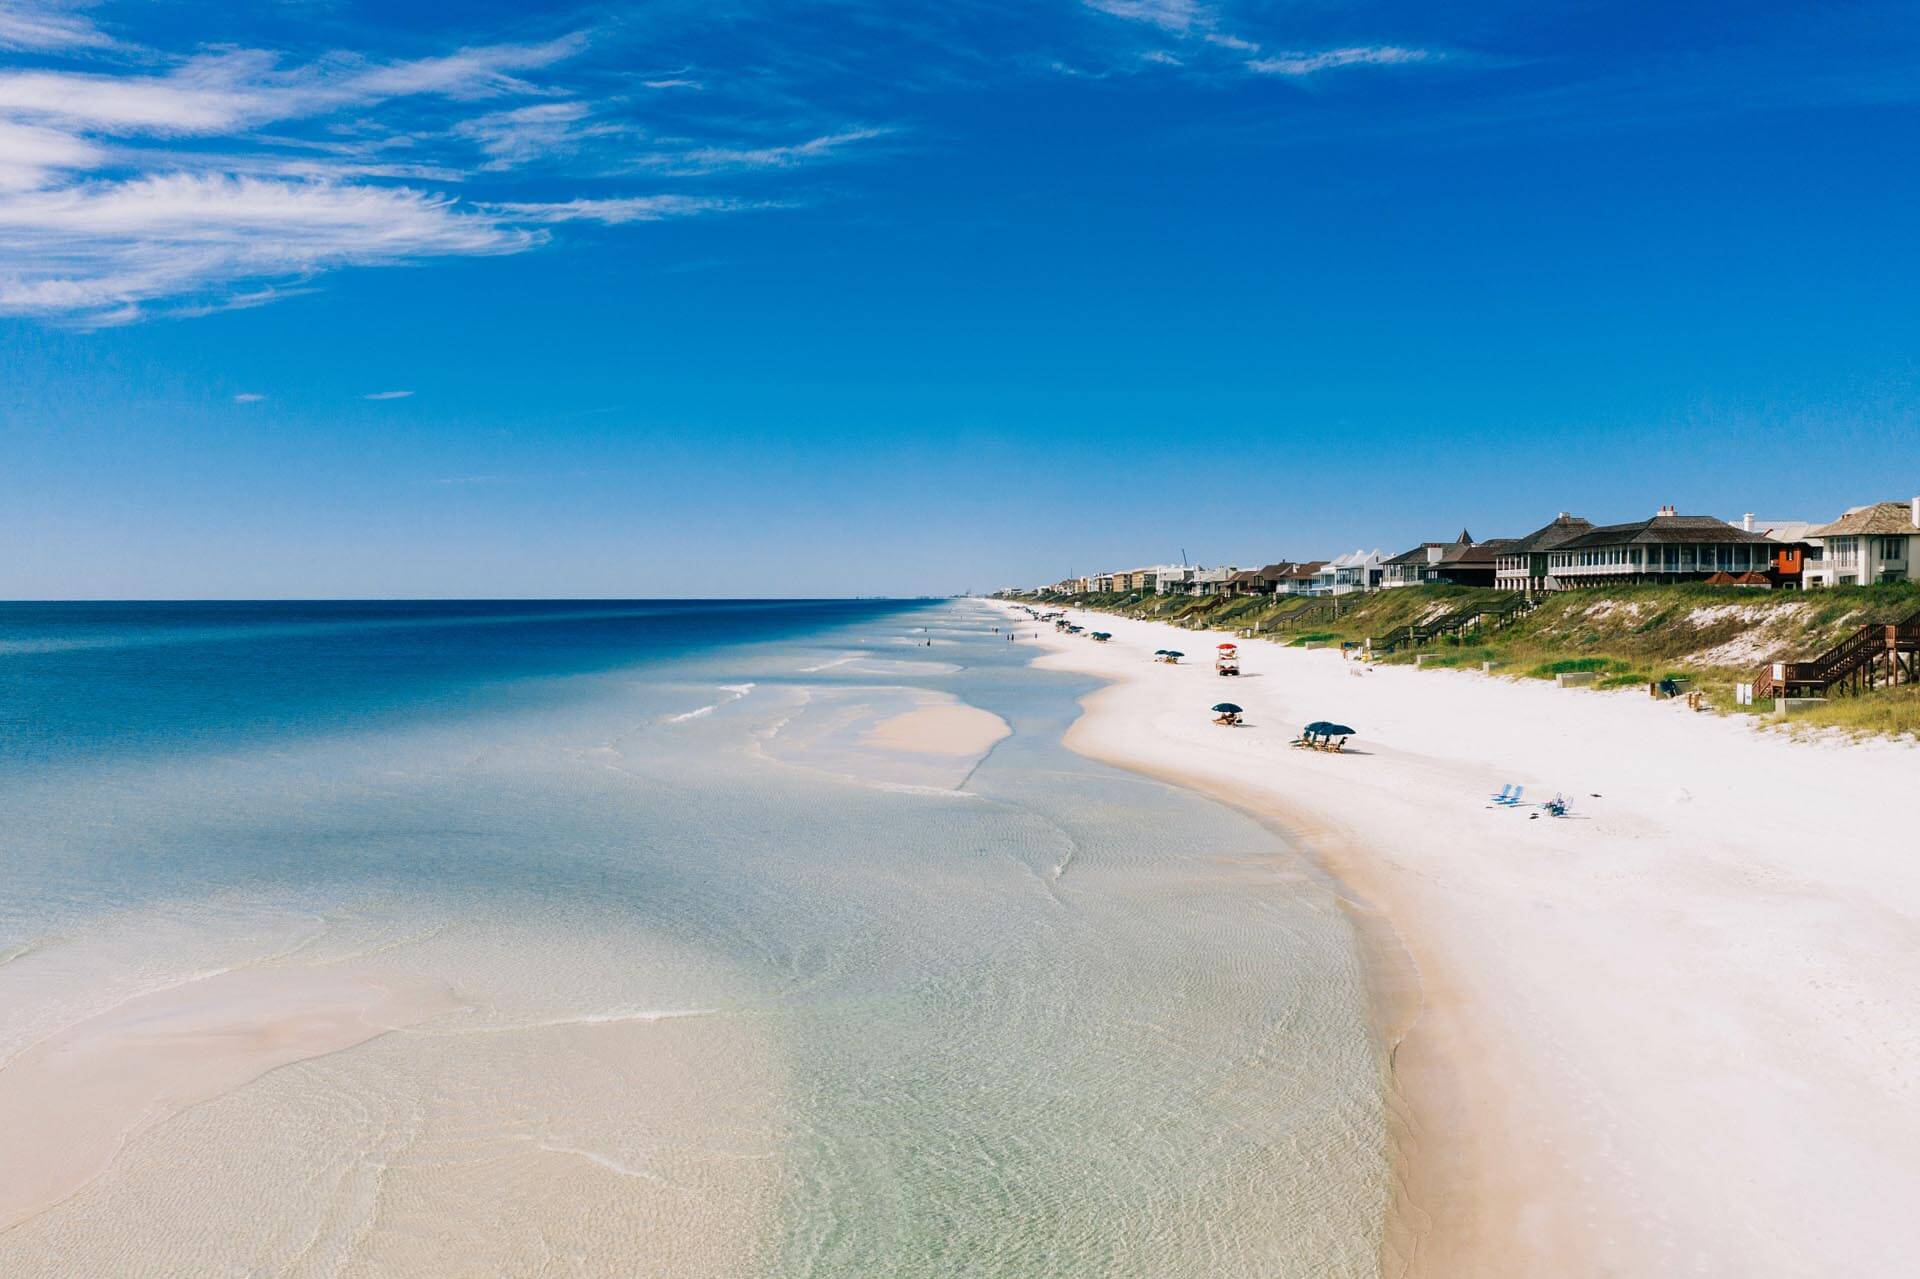
Destin has its place. Panama City Beach has its crowd. But neither of those markets offers what Cape San Blas offers: a genuinely quiet, low-density beach experience that families will drive four to seven hours to reach, year after year, and book at premium nightly rates because there simply isn’t a substitute for it.
Cape San Blas is almost entirely single-family homes and townhomes. There are no condo towers. Commercial development is minimal by design. Gulf County’s zoning has kept the peninsula from becoming another overdeveloped stretch of T-shirt shops and chain restaurants — and that scarcity is exactly what your future renters are paying for.
The typical family renting a Cape San Blas home isn’t comparison shopping between your gulf-front property and a three-bedroom condo in a high-rise tower. They’re comparing it to a similar home somewhere quieter, and they’ll pay $450 to $700 per night in peak summer to get the space, the pool, and the direct beach access. That’s the product. It’s irreplaceable, and it can’t be replicated once zoning stays what it is.
The Drivability Advantage and Its Impact on Rental Demand
One of the most durable structural demand drivers for Cape San Blas is simple geography. The peninsula sits within a seven-hour drive of roughly 30 million people across the Southeast. Atlanta is about five and a half hours. Birmingham is about four. Nashville is right around six. Tampa is under four. These aren’t fly-in vacation markets — they’re load-the-minivan-and-drive markets, and that’s exactly what families do.
That drivability trend accelerated post-2020 and it hasn’t reversed. Families want road-trip-accessible beach destinations where they control the schedule, bring the dog, and don’t pay four plane tickets. Cape San Blas checks every box.
Current Key Data market intelligence as of September 2026 shows our managed properties booking an average of 44 days in advance. That booking window maps almost perfectly to how families plan school-year breaks. A family in Atlanta plans Spring Break in early February. They lock in Memorial Day weekend in April. That 44-day average tells you the demand is structured, predictable, and driven by household planning cycles — not last-minute impulse bookings. That’s a more stable rental demand profile than most STR markets can offer.
Cape San Blas Real Estate Market Overview: What Buyers Need to Know in 2026
Before you evaluate specific cape san blas investment areas or run income projections, you need to understand the real estate market underneath those projections. The cape san blas real estate market in 2026 is slower, more buyer-friendly, and more forgiving than it was in 2022 or 2023 — and that’s not a warning. That’s the opportunity.
Current Home Prices and What They Mean for Investors
The 2025 MLS data for Cape San Blas shows an average residential sale price of approximately $1,034,278 and a median of approximately $821,000. Those numbers look big until you track where prices came from. In 2020, the average sale price on the Cape was around $658,000. By 2024, it had peaked at approximately $1.15 million. The current average represents a roughly 10% pullback from that peak — price digestion, not a collapse.
The per-square-foot story is even more stable. A mid-2026 snapshot shows Cape San Blas median price per square foot at approximately $505 — down only about 1% year-over-year. When price per foot is holding while top-line prices soften slightly, that tells you the market isn’t losing value. It’s correcting mix, not fundamentals. Larger or premium-positioned homes are sitting longer, pulling average prices down. The underlying per-foot value of quality inventory hasn’t moved much at all.
For buyers entering now: you’re acquiring assets that have appreciated substantially over a five-year horizon, at a discount to the 2024 peak, in a market with structural demand protection built into its zoning and geography. That’s a reasonable place to put capital.
Days on Market and What the Slower Pace Means for Buyers
Average days on market for Cape San Blas is running approximately 104 to 151 days depending on the sub-segment you’re looking at. A mid-2026 comparison report pegs median DOM at 109 days for Cape San Blas as of June 2026. The 2025 year-in-review data showed 142 days on market — the longest stretch since before the pandemic.
If you were buying in 2022, you had 48 hours to decide, waive inspections, and compete against six other offers. That market is gone. Today you have three to five months of listing life on most properties. That means time to do a proper inspection, get an insurance quote (critically important in Gulf County), run a realistic STR income model, and negotiate. Higher-priced gulf-front inventory in particular has negotiating room that simply didn’t exist two years ago. Use it.
Transaction Volume and Active Inventory
Despite the slower pace, buyers are still transacting. Cape San Blas and its immediate corridor saw 157 closed transactions in 2025 totaling approximately $116.2 million — up from 145 transactions and approximately $110.7 million in 2024. The residential subset alone was approximately 97 sales totaling about $100.3 million, up roughly 15% from 2024 by dollar volume. The market isn’t frozen. It’s just more deliberate.
Active inventory as of late August 2026 sits at approximately 139 homes for sale and 142 lots across Cape San Blas, Indian Pass, and the CR/SR-30A corridor. That’s meaningful selection. A year ago, finding two or three viable gulf-front homes in a specific price band was a stretch. Right now you can compare five or six. For family investors who want to be selective about lot position, pool setup, bedroom count, and HOA structure — this is the inventory environment you want to shop in.
Vacation Rental Performance Data: What the Numbers Say for Family-Oriented Properties
This is where the cape san blas vacation rental investment thesis either holds or it doesn’t. Let’s look at what the numbers actually say — both from our managed portfolio and from the broader market — so you can underwrite this honestly.
Key Data Market Intelligence — Our Managed Portfolio Performance (September 2026)
Current Key Data market intelligence pulled in September 2026 for our managed properties shows the following metrics for Cape San Blas:
- Average Daily Rate (ADR): $302.83
- Adjusted Paid Occupancy: 45.2%
- RevPAR: $106.61
- Average Booking Window: 44 days in advance
- Average Length of Stay: 5.2 nights
The ADR of $302.83 is down 23.4% from the prior year, and paid occupancy at 45.2% is down 9.4% from last year — and both of those shifts represent a favorable buyer entry point, not a reason to walk away. Here’s why: the post-pandemic STR surge pushed rates and occupancy to levels that couldn’t hold indefinitely. Markets that went from $250 to $400 ADR in 18 months are now settling back into a sustainable range. Buyers who enter now are underwriting to normalized numbers — not peak numbers that compress your returns the moment you close.
A 5.2-night average length of stay is exactly what you want to see in a family beach market. Families don’t rent for two nights. They rent for a week. That stay length reduces turnover costs, reduces wear on the property, and produces more predictable revenue per booking than nightly churn-focused urban STR models.
Area-Wide STR Benchmarks for Context
For broader market context across non-managed properties, a 2026 AirROI analysis of Cape San Blas shows approximately 87 active Airbnb listings with average annual revenue per active listing of approximately $42,133, an area-wide occupancy rate of approximately 32.4% annually, and an ADR of approximately $566 per night.
The gap between the area-wide ADR of $566 and our managed portfolio ADR of $302.83 reflects a mix difference — larger gulf-front homes and premium properties pull the area average up significantly. Our managed portfolio includes a range of property sizes and positions. For investors evaluating a direct gulf-front home in the $800,000 to $1.1 million range, targeting an ADR in the $450 to $700 band in peak season is realistic and supported by the data.
The 32.4% area-wide annual occupancy figure is worth understanding in context. Cape San Blas is a genuine seasonal market. It earns the bulk of its revenue in a concentrated window — Spring Break, Memorial Day through mid-August, Thanksgiving, and Christmas week. Many owners block out personal use time during those same peak periods. Professionally managed, well-reviewed family properties in established HOA communities can realistically target 38% to 50% annual occupancy. For conservative underwriting, model 30% to 40% and stress-test down to 25%. At an ADR of $450 to $550 and 35% occupancy, the math works on realistically financed deals.
Peak Seasons and What Drives Bookings for Family Rentals
Understanding cape san blas short term rental performance means understanding when the money comes in and why. For family-oriented properties, the revenue calendar looks like this:
Late March through April (Spring Break): High-demand window driven by drivable family markets — Atlanta, Birmingham, and Nashville school calendars. ADRs spike and these weeks book 6 to 8 weeks out.
Memorial Day through mid-August: The core revenue season. Gulf-front homes with pools command $550 to $700 per night. This window alone can cover 40% to 50% of annual rental revenue for a well-positioned property.
Thanksgiving and Christmas/New Year’s weeks: Smaller windows but strong premium-rate opportunities, especially for larger homes that sleep 10 to 14. Multi-generational family groups book these early and pay for the space.
September through October: Increasingly strong shoulder season. Weather is excellent, crowds are gone, and multi-generational groups and early retirees are discovering the Cape in fall. ADRs are softer but occupancy holds better than you’d expect.
Best Family-Oriented Investment Areas Within Cape San Blas
Not every pocket of the Cape performs equally. Here’s how to think about the sub-areas for family-oriented investment.
Gulf-Front Corridor (mid-peninsula): The highest-ADR inventory on the Cape. Direct gulf access, larger lot sizes, and pool-equipped homes are the dominant product type here. These properties sit in the $900,000 to $1.4 million range in 2026 and target the $550 to $700 per night ADR band in peak season. Buyer competition is lower than it was in 2023 and DOM is longer — negotiating room exists on this inventory today.
Barrier Dunes and Seacliffs HOA Communities: Gated, amenity-rich communities that attract repeat family renters. The HOA structure provides property maintenance consistency and community standards that protect your asset quality over time. These townhomes and homes typically run in the $650,000 to $950,000 range and target a $300 to $450 ADR band — a more accessible entry point with solid occupancy performance.
Indian Pass Corridor: A quieter, more affordable adjacent market that appeals to budget-conscious family buyers. Properties here are priced lower, DOM is similar, and the buyer profile is often a first-time STR investor or a second-home buyer who wants lower entry cost with strong family rental appeal. Keep an eye on this corridor for value-add opportunities.
Frequently Asked Questions
What is the average short-term rental revenue for a Cape San Blas vacation home?
Area-wide data shows average annual STR revenue of approximately $42,133 per active listing in Cape San Blas. Professionally managed gulf-front homes with pools can meaningfully exceed that figure, while interior or smaller properties may come in below. Our managed properties are currently generating a RevPAR of $106.61 based on current Key Data market intelligence from September 2026. Model conservatively at 30% to 35% annual occupancy and an ADR appropriate to your specific property’s gulf position and bedroom count — then stress-test down to 25% occupancy before you commit.
Are Cape San Blas home prices still going up in 2026?
Prices are in a plateau phase after peaking around $1.15 million average in 2024. The 2025 average closed at approximately $1,034,278 — off about 10% from the peak. Price per square foot is holding much more steadily at approximately $505, down only about 1% year-over-year. This is price digestion, not a market correction. The five-year appreciation story — from roughly $658,000 in 2020 to over $1 million today — remains intact. Buyers entering now are picking up well-appreciated assets at a discount to peak.
How long does it take to sell a home in Cape San Blas right now?
Average days on market is running approximately 104 to 151 days in 2026 depending on the segment, with a mid-year snapshot showing 109 median DOM. That’s a significant shift from the pandemic-era market. For buyers, this is an advantage — you now have time for thorough due diligence, insurance underwriting, and STR income modeling before committing.
What type of property performs best as a family vacation rental on Cape San Blas?
Gulf-front single-family homes with private pools and four or more bedrooms consistently outperform on ADR and booking pace. Families traveling with multiple generations or two families sharing a rental need space, privacy, and direct beach access — and they’ll pay for it. HOA communities like Barrier Dunes and Seacliffs offer an added layer of property quality consistency that keeps repeat bookings coming. Pool, gulf view, bedroom count, and professional management are the four variables that most directly drive performance in this market.
Is Cape San Blas a good investment compared to 30A or Panama City Beach?
It depends on your investment profile. Cape San Blas offers lower price points than premium 30A inventory, significantly lower density than Panama City Beach, and a family-focused renter base that books longer stays and returns year after year. The tradeoff is a shorter peak season and a slower market overall. For investors who can hold long-term, want a lower-competition market, and prefer the single-family home product over condo towers, Cape San Blas is a compelling alternative with structural scarcity built in.
Ready to Invest in Cape San Blas?
Rent & Relax Vacation Rentals manages over 100 properties along Florida’s Emerald Coast — including Cape San Blas. We know this market from the ground up: what rents, what sits, what guests book twice, and what surprises investors after closing. If you’re evaluating a purchase on the Cape and want to run real income projections against current Key Data market intelligence, we’re the team to talk to. Reach out to Rent & Relax today and let’s look at the numbers together before you make your next move.