Cape San Blas Vacation Rental Management Guide: What Every Investor Needs to Know in 2026
If you’re looking at Cape San Blas vacation rental management as a serious investment conversation, you’re in the right place. This guide is built for buyers, investors, and homeowners who want the real numbers — not the glossy brochure version. Right now, in September 2026, Cape San Blas is sitting in one of the more favorable buyer entry windows we’ve seen in years. ADR is down. Days on market have stretched out. And that means sellers are negotiable, cap rates are more honest, and a patient buyer with accurate underwriting can get into a market that still commands some of the highest average daily rates on Florida’s Forgotten Coast.
We’re going to walk through current rental performance, real estate pricing, seasonality, and how to think about the numbers before you sign anything.
Understanding the Cape San Blas Vacation Rental Market in 2026
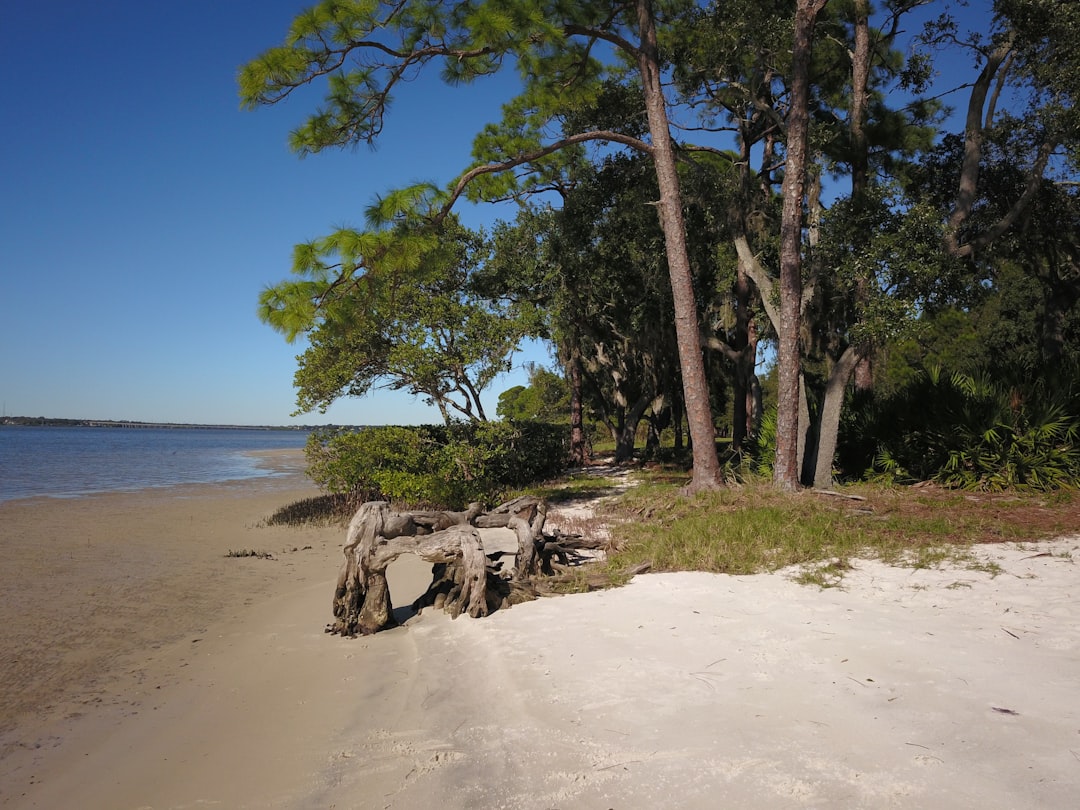
Cape San Blas is not a sprawling resort corridor. It’s a narrow Gulf County peninsula with limited supply, no high-rise development, and a buyer base that mostly wants the exact opposite of Panama City Beach. That supply constraint is a long-term asset. But right now, the short-term data tells a nuanced story — and knowing that story is the difference between underwriting a deal accurately and overpaying based on 2021 comp sheets.
Current Rental Performance Benchmarks
Here’s what the real numbers look like. These are current Key Data market intelligence figures from our managed portfolio, as of September 2026:
- Average Daily Rate (ADR): $303.60
- Adjusted Paid Occupancy: 45.0%
- RevPAR: $106.55
- Average Booking Window: 45 days in advance
- Average Length of Stay: 5.2 nights
ADR is down 23.3% from the prior year. Occupancy is down 9.4%. If you’re a seller reading that, it stings. If you’re a buyer reading that, you should be paying close attention — because those same numbers are exactly why you can negotiate harder on purchase price today than you could have 18 months ago. The revenue compression is real, but it’s already baked into what sellers are asking. That’s the entry window.
For investors underwriting a deal, use these figures as your baseline. They’re not projections. They’re not aspirational. They’re managed-property performance numbers from a portfolio of actively operated Cape San Blas rentals pulled in September 2026.
How Cape San Blas Compares to Broader Market Benchmarks
For context on what self-managed and competitor units are doing, market-wide Airbnb data from AirROI shows approximately 87 active listings on the Cape with an average annual revenue per listing of about $42,133 and an ADR of roughly $566. That’s a meaningful gap from our managed portfolio ADR — and it reflects a mix of unit types, self-managed operations, and varying quality tiers across the market.
CrestCove STR analysis for Cape San Blas shows blended Airbnb and Vrbo occupancy in the 50–54% range, with approximately 4% year-over-year growth on multi-platform listings. Compare that to Airbnb-only occupancy sitting around 32–33% in the same market. That gap tells you something important: single-platform distribution leaves money on the table. Multi-platform management — running on Airbnb, Vrbo, and direct booking channels simultaneously — is where the occupancy gains actually show up.
The market-wide data is your baseline for what’s possible. Your management strategy, pricing engine, and distribution reach determine where in that range your property actually lands.
Cape San Blas Investment Property Pricing and the Buyer Entry Window
Let’s talk real estate. If you’re underwriting a Cape San Blas investment property in 2026, you need to cut through a lot of noise on the pricing side. National portal median prices and local MLS averages are telling very different stories right now — and both are partially right.
What Vacation Rental Properties Are Actually Selling For
Here’s how to read the pricing tiers honestly:
National portals are currently printing Cape San Blas median home prices in the $445,900 to $647,900 range. Those numbers are real, but they include off-beach product, lots, and non-STR inventory. They’re not the assets you’re buying if you want a performing vacation rental.
The MLS-based average for Cape San Blas residential sales across full-year 2025 came in at approximately $1,034,278. That’s a more accurate anchor for what actual homes — not raw land or non-beach product — are trading at.
For working investors, here’s the honest pricing map: most Gulf-access and walk-to-beach inventory that’s actually viable as a vacation rental trades in the $800,000 to $1.2 million range. Gulf-front luxury pushes into the $1 million to $2 million-plus tier. A micro-market like Villa Del Sol — a Gulf-front community on the Cape — printed a 12-month median around $2,099,000 through July 2026, with sellers getting approximately 98% of original ask and properties moving in about 45 days.
The national portal figures are context. The MLS average and Gulf-front comps are what you’re actually shopping in.
Days on Market — What the Data Tells Buyers
This is where the buyer opportunity gets concrete. DOM on Cape San Blas has stretched dramatically since the peak market:
- 2022 average DOM: approximately 36 days
- Full-year 2024 average DOM: approximately 107 days
- Full-year 2025 average DOM: approximately 142 days — up about 33% from 2024
- H1 2025 average DOM: approximately 151 days, compared to 81 days in H1 2024
Longer DOM is not a market failure. It’s negotiating leverage for a buyer. When a seller has been sitting on a listing for 120-plus days, the conversation around price, terms, and seller concessions is very different than it was when properties were going in 36 days with multiple offers.
Plan your timeline accordingly. Mid-tier inventory on the Cape should be underwritten at 90 to 150 days to sell if you ever need to exit. Premium Gulf-front product — think Villa Del Sol — is still the exception, moving closer to 45 days. But for the bulk of the market, patience is the asset right now, whether you’re buying or selling.
Why Softening Metrics Create a Real Buyer Opportunity
Connect the two datasets and the investment thesis gets clear fast. ADR down 23.3% and occupancy down 9.4% means sellers of rental properties are looking at compressed income statements right now. That revenue softness gives buyers a legitimate basis to push on price — and sellers who’ve been sitting on the market for 142 days know it.
The properties that were priced based on 2022 peak revenue are now competing in a market where buyers can underwrite at today’s actual performance numbers and use that to negotiate accordingly. That’s the entry window. It doesn’t stay open forever — but it’s open right now.
Seasonality and Revenue Strategy for Cape San Blas Rentals
Cape San Blas is an intensely seasonal market. Understanding the seasonal pattern is non-negotiable before you commit to an income projection.
Peak Season Performance
Based on market-wide data from AirROI and CrestCove analysis, June and July are the clear peaks — ADR running around $610 to $614 during those months, with occupancy averaging around 50.2% across peak season months including March. Spring break fills the gap between summer and winter, and the Forgotten Coast draws a loyal repeat visitor base that tends to book early for peak weeks.
The 45-day average booking window from our current Key Data market intelligence figures tells you something important: Cape San Blas guests are not last-minute bookers on average. That gives you a real-time pricing window to adjust rates as peak weeks approach without panicking into discounts too early.
Shoulder and Low Season Reality
January, November, and December are the soft months. Market-wide occupancy drops to around 22.8% in low season, with ADR holding around $513 even when demand is thin. That ADR floor — staying above $500 even in January — is part of what makes Cape San Blas a different animal than a purely seasonal Gulf Coast market.
The play in shoulder season is filling midweek gaps, targeting longer stays (the 5.2-night average length of stay in our managed portfolio reflects this strategy), and keeping listing quality sharp enough to win the bookings that are actually in the market. Properties that struggle in shoulder season are almost always losing on listing quality, pricing strategy, or both.
What Professional Cape San Blas Property Management Actually Delivers
Here’s the honest version of this conversation. Self-managing a Cape San Blas rental from out of state is doable — until it isn’t. The Cape is remote. Maintenance response time matters. Guest communication at 11 PM matters. And distribution across Airbnb, Vrbo, and direct booking channels matters more than most owners realize until they see the occupancy gap between single-platform and multi-platform listings.
The CrestCove data showed roughly 4% year-over-year occupancy growth on multi-platform listings versus flat or declining performance on Airbnb-only listings. That’s not a coincidence. It’s a distribution strategy producing a measurable result.
Rent & Relax manages 100-plus vacation rentals across the Emerald Coast and Forgotten Coast markets. On Cape San Blas, that means local maintenance networks, active channel management across platforms, dynamic pricing calibrated to real-time demand, and owner reporting built on the same Key Data infrastructure that produced every number in this guide.
If you own a property on the Cape and you’re running it yourself or with a manager who isn’t using real-time performance data, you are leaving occupancy and revenue on the table. That’s not an opinion — the gap between Airbnb-only occupancy (32–33%) and blended multi-platform occupancy (50–54%) in this exact market makes the math straightforward.
Frequently Asked Questions
What is the average daily rate for vacation rentals on Cape San Blas right now?
Based on current Key Data market intelligence from our managed portfolio as of September 2026, the average daily rate on Cape San Blas is $303.60. Market-wide Airbnb data from AirROI shows a higher ADR of approximately $566 — that figure reflects a different mix of property types and self-managed units. For underwriting purposes, use the $303.60 figure as your conservative managed-property baseline and work up from there based on property quality, location, and platform distribution.
How long does it take to sell a vacation rental property on Cape San Blas?
Plan for 90 to 150 days for most mid-tier inventory based on full-year 2025 MLS data showing an average DOM of approximately 142 days. Premium Gulf-front product in sought-after communities like Villa Del Sol is moving closer to 45 days at roughly 98% of asking price. If your exit timeline matters to your investment thesis, buy A-plus Gulf-front product and price it accurately from day one.
Is Cape San Blas a good market for vacation rental investment in 2026?
Yes — with accurate underwriting. The market has softened from 2022 peak metrics, which means buyers can negotiate better purchase prices and entry cap rates are more favorable than they were 24 to 36 months ago. Limited supply on the Gulf County peninsula, a loyal repeat visitor base, and strong peak-season ADR all support long-term fundamentals. The key is buying at today’s real revenue figures, not projecting a return to 2022 peak performance.
What occupancy rate should I underwrite for a Cape San Blas rental?
Current Key Data market intelligence from our managed properties shows adjusted paid occupancy at 45.0% as of September 2026. Blended Airbnb and Vrbo occupancy across the broader market runs 50–54% for multi-platform listings. Use 45–50% as your underwriting range depending on whether you’ll be professionally managed on multiple platforms or operating on a single channel. Do not underwrite at peak-year figures unless you have a specific property history to support it.
What does professional property management cost on Cape San Blas?
Management fees on Cape San Blas typically run in the 20–30% gross revenue range depending on service level, included maintenance, and the manager’s distribution reach. The right question isn’t what management costs — it’s what the net revenue gap is between a professionally managed multi-platform listing and a self-managed single-platform one. In a market where multi-platform blended occupancy runs 15 to 20 points higher than Airbnb-only occupancy, that gap usually covers the management fee and then some.
Ready to Invest in Cape San Blas?
Whether you’re buying your first vacation rental on the Cape or you own a property that isn’t performing the way it should, Rent & Relax Vacation Rentals can show you exactly where you stand. We manage 100-plus properties across Florida’s Emerald and Forgotten Coasts, and our Cape San Blas portfolio runs on real-time Key Data intelligence — the same numbers you just read in this guide.
Give us a call or send us a message. We’ll pull the current performance benchmarks for your specific property type, walk you through what a managed revenue projection looks like in today’s market, and tell you straight whether the numbers make sense. No pressure, no fluff — just a real conversation about whether this investment works for you.
Contact Rent & Relax Vacation Rentals today to get a free rental performance analysis for your Cape San Blas property.