Is Treasure Island Resort a Good Investment Property? A Data-Driven Panama City Beach Buyer Guide
If you’ve been researching a Treasure Island Resort investment property in Panama City Beach, you’ve probably seen the photos — Gulf-front views, resort pools, 23 stories of prime real estate on the eastern end of PCB. It looks like a no-brainer. But looks don’t pay HOA dues. What you actually need before you write an offer is the real performance data: occupancy rates, average daily rate, days on market, and a straight answer on whether this building pencils out as a rental investment in 2026. That’s exactly what this guide delivers.
We manage vacation rentals at Treasure Island Resort through Rent & Relax Vacation Rentals, so we’re pulling from current Key Data market intelligence — not guesswork — alongside public market data to give you the clearest picture available.
What Is Treasure Island Resort in Panama City Beach?
Building Overview and Location
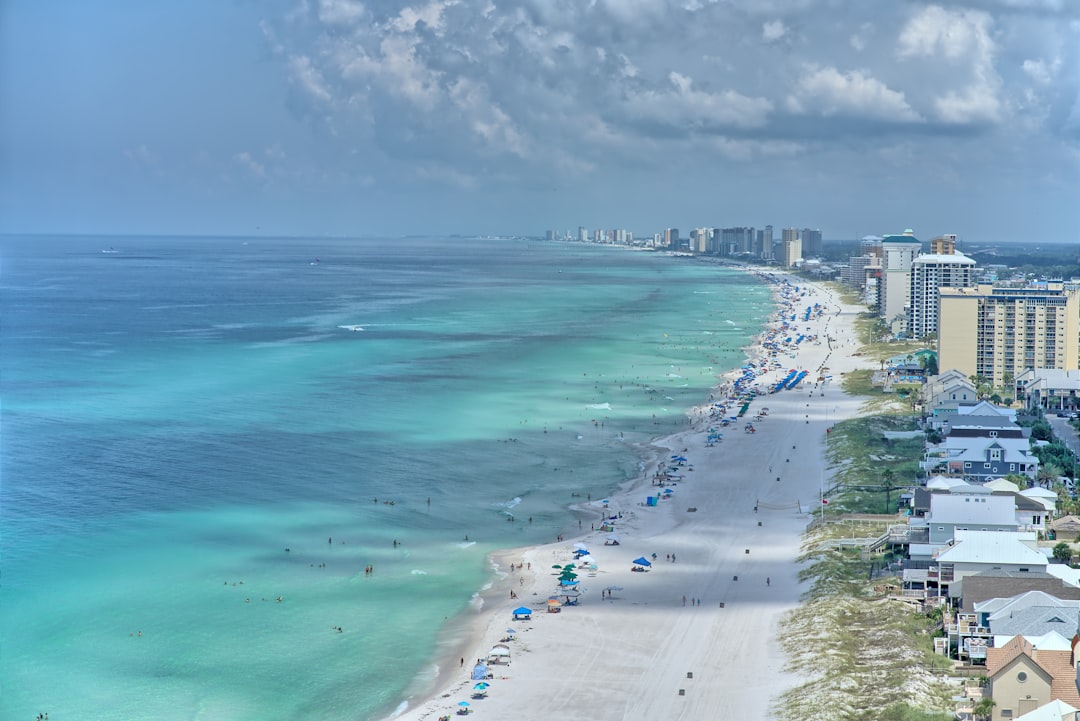
Treasure Island Resort Panama City Beach is a 23-story Gulf-front high-rise condominium built in 2005. The building has approximately 263–265 total units and sits in the Lower Grand Lagoon / Thomas Drive corridor on the eastern end of Panama City Beach — a stretch that draws consistent vacation rental demand without the wall-to-wall crowds of the central PCB strip.
Amenities include Gulf beach access, resort-style pool facilities, and on-site recreational features that guests expect from a full-service beach property. The building has an established name in the vacation rental market, which matters when you’re competing for bookings against thousands of other PCB condos. Travelers recognize it. That recognition has real dollar value.
Why Gulf-Front High-Rise Buildings Attract Investors
Gulf-front views and premium floor plans — especially higher floors with unobstructed water views — command significantly higher average daily rates than comparable inland or pool-view units. At Treasure Island, that pricing advantage shows up in our rental data (more on that shortly).
Resort-style amenities also matter. When a property has pools, beach access, and on-site features built in, investors don’t have to compete on rate alone. The amenities do work on your behalf.
Established buildings also have a track record. Unlike new construction, a 2005-built tower like Treasure Island has rental history, comparable sales data, and a known HOA structure. That makes underwriting more reliable. You’re not guessing what the market will do — you can see what it has done.
That said, Gulf-front premium location comes with Gulf-front premium costs. Acquisition price, HOA dues, insurance, and reserves all run higher here than in inland or second-row properties. Both sides of the ledger matter when you’re evaluating this as a rental investment.
Current Treasure Island Resort Market Pricing — What Buyers Are Paying Right Now
Active Listings and Recent Sales Data
If you’re shopping for Treasure Island Resort condos for sale, here’s the current pricing picture. The median listing price sits at approximately $652,450 per Realtor.com, with roughly 9 active listings on market at any given time depending on the data source and timing of the MLS pull.
Days on market tell an interesting story. Realtor.com shows a median DOM of 79 days. BrowseDestin’s 12-month closed transaction data shows an average DOM of 228 days for units that actually sold. That gap between list-to-pending and list-to-close is worth paying attention to — units are sitting longer than headline numbers suggest, and that’s useful information at the negotiating table.
Recent closed sales from 2025 market data came in at $615,000, $600,000, and $578,000 — a sequential decline that tells you sellers are working harder to close deals than they were 18 months ago. BrowseDestin also reports two closed sales over the trailing 12-month period at an average price of $666,000 and an average DOM of 228 days.
What the Inventory Trend Means for Buyers Today
Here’s the headline for buyers: inventory at Treasure Island reportedly climbed from approximately 6 months of supply to 19 months of supply. That’s a massive shift in negotiating dynamics, and it’s entirely in your favor if you’re a buyer.
This is not a distressed building. This is not a signal that something is wrong with the asset. This is a market that has rebalanced toward buyers, and that means you have more time to underwrite carefully, more room to negotiate on price or terms, and less risk of overpaying because you felt rushed. Buyers who enter Treasure Island in this environment are working from a far more favorable position than buyers who purchased at the 2022 peak.
If you’ve been waiting for the right window to look at a Panama City Beach condo investment in an established Gulf-front building, the current inventory and DOM data suggest that window is open right now.
Treasure Island Resort Vacation Rental Performance — The Real Numbers
Our Managed Portfolio Performance at Treasure Island Resort
This is the section that matters most. Here’s what our managed properties at Treasure Island Resort are actually generating, pulled directly from our current Key Data market intelligence dashboard as of June 2026:
Average Daily Rate (ADR): $344.11
This figure is down 17.1% year-over-year. Before you read that as a red flag, flip it around: buyers underwriting a Treasure Island Resort investment property today are working from a more conservative ADR baseline than peak-cycle buyers were in 2021 and 2022. That’s a feature, not a bug. You’re not buying into inflated projections that can only disappoint. You’re buying into a realistic revenue base with room to grow as the market stabilizes.
Adjusted Paid Occupancy: 51.0%
Occupancy is up 4% year-over-year. Read that combination carefully: rates have moderated while occupancy is growing. That’s a constructive dynamic for long-term investors. Demand is building. The revenue-per-booking has compressed, but the building is filling more nights. That’s a healthier foundation than high rates masking weak demand.
RevPAR (Revenue Per Available Room): $140.80
RevPAR is the single most useful blended performance metric for comparing investment properties. It captures both rate and occupancy in one number, which means you can use it to benchmark Treasure Island against other PCB buildings without getting distorted by outlier peak-season weeks. At $140.80, Treasure Island is generating meaningful revenue per available night across the full calendar year.
Average Booking Window: 51 days in advance
Guests are booking nearly two months out. That matters for how you price and manage the property. A 51-day lead time gives you real data to work with on revenue management — you can see demand coming and adjust pricing before the booking window closes. Last-minute-heavy properties are harder to optimize. This booking window tells you guests are planning their trips to Treasure Island, not impulse-booking.
Average Length of Stay: 5.2 nights
Longer stays mean fewer turnovers, fewer cleaning cycles, and less operational friction. At 5.2 nights, the average Treasure Island guest is staying for the better part of a week. That reduces your variable costs and makes the property easier to manage — whether you’re doing it yourself or working with a professional management company.
Source: Key Data market intelligence dashboard, Rent & Relax Vacation Rentals managed portfolio, data pull June 2026.
How These Numbers Benchmark Against the Broader PCB Market
For Gulf-front PCB condos of comparable size and location, a reasonable professional underwriting range for annual occupancy is approximately 55%–70%, depending on unit condition, floor level, view category, and owner-blocked dates. Our managed properties are currently at 51.0% — below that benchmark range, but trending up 4% year-over-year. A well-conditioned upper-floor unit with Gulf views and zero owner blocking could realistically close that gap.
On ADR, Gulf-front 2BR units in the Lower Grand Lagoon corridor typically range from the mid-$200s to mid-$400s per night in season, with 3BR end units running higher. Our portfolio ADR of $344.11 falls squarely in that band, confirming that Treasure Island units are performing in line with the broader east-end PCB comp set.
Cap Rate Estimates and Investment Return Expectations
Let’s talk about what the math actually looks like on a PCB vacation rental property at this price point.
Based on current pricing (call it $600,000–$650,000 for a realistic acquisition target given recent sold comps) and the revenue performance our managed properties are generating, a well-operated Treasure Island unit can be underwritten to a gross cap rate in the range of 4%–7% depending on HOA fees, insurance costs, reserves, and financing structure. That’s not a high-yield play. This is not a property that generates 10% cap rates and makes your spreadsheet look like a slam dunk.
What it is: a cash-flow-plus-appreciation play on a Gulf-front asset in an established building with strong resale appeal. The investors who do well here are typically buyers who want a beach property that covers its carrying costs, generates meaningful rental income in peak season, and builds equity over a 5-to-10-year hold period — not buyers chasing maximum yield in year one.
One important note: verify current HOA dues before you go under contract. For a 23-story Gulf-front tower built in 2005, expect monthly HOA dues that are material enough to move the needle on your cash flow analysis. Don’t underwrite this property without that number in hand.
Key Buyer Risk Factors to Understand Before You Offer
No honest buyer guide skips the risks. Here are the ones that matter most at Treasure Island:
Insurance costs: Gulf-front Panama City Beach condos carry elevated wind, hurricane, and flood-related insurance exposure. Premiums have increased significantly across the Florida Gulf Coast market, and you should underwrite for continued pressure here — including the possibility of special assessments following storm events.
Financing eligibility: Condo financing depends on project-level factors — owner-occupancy ratio, reserve fund strength, litigation status, and lender concentration rules. Confirm building eligibility for your intended loan program before you’re under contract, not after. This is a step buyers skip and then regret.
Seasonality: Panama City Beach rental income is highly seasonal. Peak demand clusters around spring break in March, summer from June through August, and major holiday weeks. Late fall and early winter outside of holidays are slow. Your revenue model needs to account for that curve, not just your best-case summer numbers.
Unit-level differentiation: Not every unit at Treasure Island performs the same. Floor level, view category, unit size, and interior condition all affect your ADR and occupancy. Higher floors with direct Gulf views out-earn lower floors. A renovated unit out-earns an original-finish unit. Buy the right unit, not just the right building.
Frequently Asked Questions
What is the average daily rate for a Treasure Island Resort rental in Panama City Beach?
Based on current Key Data market intelligence from our managed portfolio as of June 2026, the average daily rate across our Treasure Island properties is $344.11. Individual unit performance varies by floor level, view, and unit size — Gulf-view upper-floor units typically command rates at the higher end of the range for the building.
What occupancy rate can I expect at Treasure Island Resort?
Our managed properties are currently running at 51.0% adjusted paid occupancy, up 4% year-over-year per June 2026 Key Data figures. Professionally managed Gulf-front PCB condos in this corridor generally underwrite to a range of 55%–70% annually depending on unit condition and owner availability. There is room to grow from the current baseline with strong management and competitive pricing strategy.
Is now a good time to buy at Treasure Island Resort?
The current buyer data makes a reasonable case for yes. Inventory has climbed to approximately 19 months of supply, DOM has extended to 228 days on closed transactions, and recent sold prices have come in sequentially lower — $615,000, $600,000, and $578,000. That combination gives buyers real negotiating leverage and removes much of the overpayment risk that existed during the 2021–2022 peak cycle. Buyers who underwrite conservatively and negotiate well are entering from a stronger position than at any point in the last several years.
What are the biggest risks of buying a condo at Treasure Island Resort?
The three biggest risks are insurance costs (Gulf-front wind and hurricane exposure is real and rising), financing eligibility (confirm condo project approval for your loan program early), and seasonality (PCB rental income is heavily front-loaded into spring and summer, and your underwriting needs to reflect the full annual curve, not just peak weeks).
Does Rent & Relax manage vacation rentals at Treasure Island Resort?
Yes. We actively manage vacation rental properties at Treasure Island Resort and have current, first-hand performance data on the building. If you’re evaluating a purchase and want to understand what your specific unit could realistically generate, we can walk you through the numbers before you make an offer — not after.
Ready to Invest in Treasure Island Resort?
Treasure Island Resort is a real Gulf-front asset with proven rental demand, strong traveler recognition, and a buyer market that currently favors negotiation over competition. It’s not a maximum-yield property. But for investors who want a beach asset that covers its costs, generates meaningful seasonal income, and holds long-term resale value, it deserves a serious look — especially at today’s pricing and inventory levels.
At Rent & Relax Vacation Rentals, we manage 100+ properties along Florida’s Emerald Coast, including units at Treasure Island Resort. We know what these properties earn, what they cost to operate, and what separates a deal that works from one that doesn’t.
Contact our team before you make an offer. We’ll share current performance data from our managed portfolio, help you identify which units in the building are worth targeting, and connect you with local professionals who know this market. No pressure, no pitch — just straight answers from people who run these properties every day.
Reach out to Rent & Relax Vacation Rentals and let’s look at the numbers together.