St George Island Gulf Front vs Gulf View ROI: What Buyers and Investors Need to Know in 2026
Is the unobstructed view worth an extra $300,000 — or does the property across the road quietly outperform it every year? That’s the question every serious buyer on St. George Island eventually lands on, and it’s the right one to ask. The st george island gulf front vs gulf view roi debate isn’t just about bragging rights or listing photos. It’s a real underwriting decision with real money on the line. We’re talking median sale prices around $1.20–$1.23 million, seasonal rental income that swings hard between May and November, and insurance premiums that can quietly eat your cap rate alive if you’re not paying attention.
This post uses current Key Data market intelligence from our managed properties at Rent & Relax Vacation Rentals — data pulled October 2026 — alongside broader market benchmarks to give you the clearest picture we can. No fluff. Just numbers and what they actually mean for your purchase decision.
Understanding the St. George Island Real Estate Market Before You Compare Property Types
Before you can intelligently compare a gulf front home to a gulf view home on St. George Island, you need to understand the market environment you’re buying into. Right now, that environment is leaning toward buyers — and that matters a lot when you’re running ROI models on seven-figure properties.
What the 2026 St. George Island Real Estate Market Data Actually Tells Buyers
Here’s what the current data shows across available datasets as of mid-to-late 2026:
- Median sale price: approximately $1.20–$1.23 million
- Median listing price: $1.15–$1.24 million depending on the reporting period
- Price per square foot: $573–$619, with some year-over-year movement as high as 24.5%
- Days to close or go pending: 121–133 days
- Sale-to-list ratio: approximately 94%–95%
- Active inventory: approximately 208–223 listings
One dataset shows a 37.7% year-over-year price increase. Another shows declining price-per-square-foot trends. That kind of volatility in reported appreciation figures tells you one thing: don’t buy this property banking on price runup. Underwrite to cash flow and current cap rate, period.
Why These Market Conditions Create a Strategic Buyer Entry Point
When a home sits on the market for 121–133 days before going to contract, motivated sellers start showing up. That’s not a market in distress — it’s a market with negotiating room, and that room is meaningful on a $1.2 million asset.
A buyer who underwrites to 94%–95% of asking price on a $1.2 million listing saves $60,000–$72,000 at closing. That’s not a rounding error. That delta directly improves your cap rate math on day one. On a property generating roughly $49,847 in gross annual revenue, shaving $72,000 off the purchase price moves your gross yield from 4.2% to nearly 4.6% before you’ve changed a single operational variable.
The buyers who win on St. George Island right now are the ones doing the math — not the ones reacting to a headline that says prices are up 37%.
What This Favorable Entry Point Means for Gulf Front and Gulf View Buyers Specifically
For gulf front buyers, high nominal prices compress gross yields. When a gulf front home is listed at $1.5 million or more, even a great rental season may only produce a 3.3% gross yield before expenses. Every dollar you negotiate off that purchase price has outsized impact on the cap rate. Getting to $1.38 million on a $1.45 million ask isn’t just satisfying — it could be the difference between a deal that works and one that doesn’t.
For gulf view buyers, the math can look considerably better out of the gate — but only if the property retains strong rental attributes: beach proximity, pool, genuine view permanence, and competitive bedroom count. A gulf view property purchased at $850,000 with those features in place can produce a gross yield above 5.8%, which opens the door to a stabilized cap rate in the 3%–5% range after expenses.
Gulf Front vs Gulf View — What the Labels Really Mean on St. George Island
The terms get blurred in listing descriptions all the time. Let’s be precise about what you’re actually buying when you see each label on St. George Island.
Defining Gulf Front on St. George Island
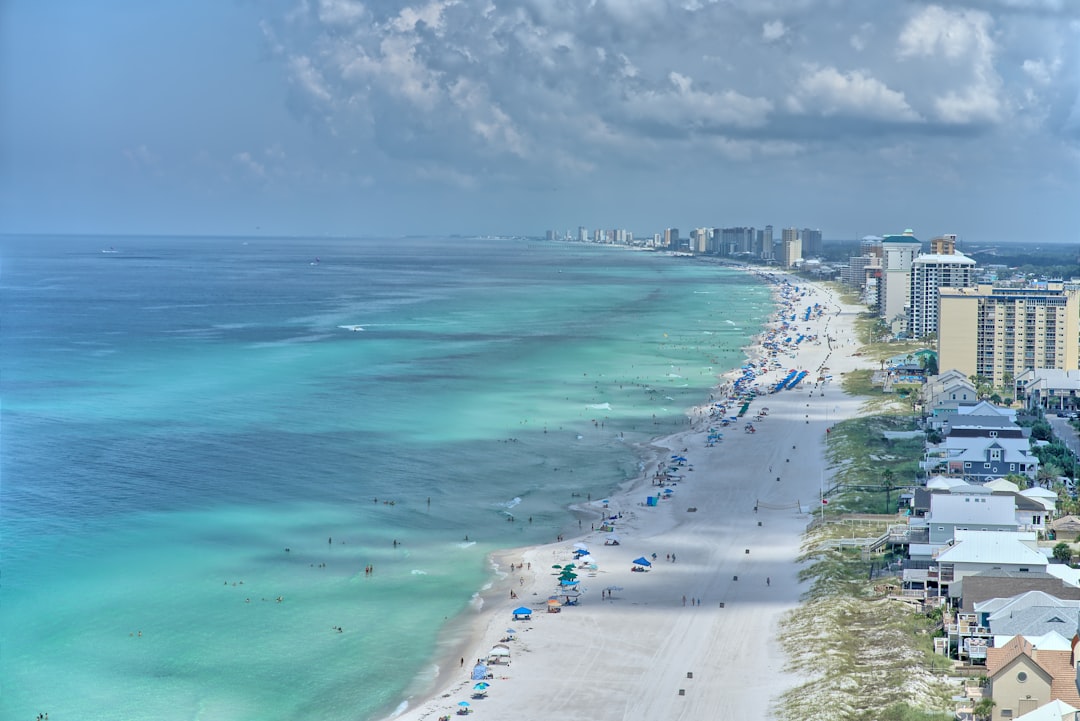
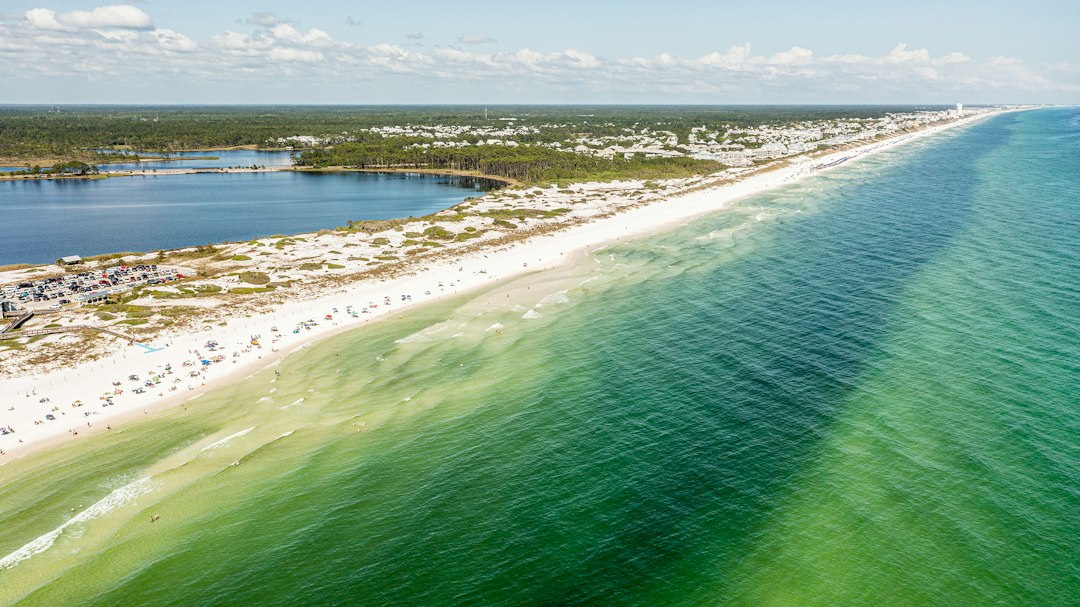
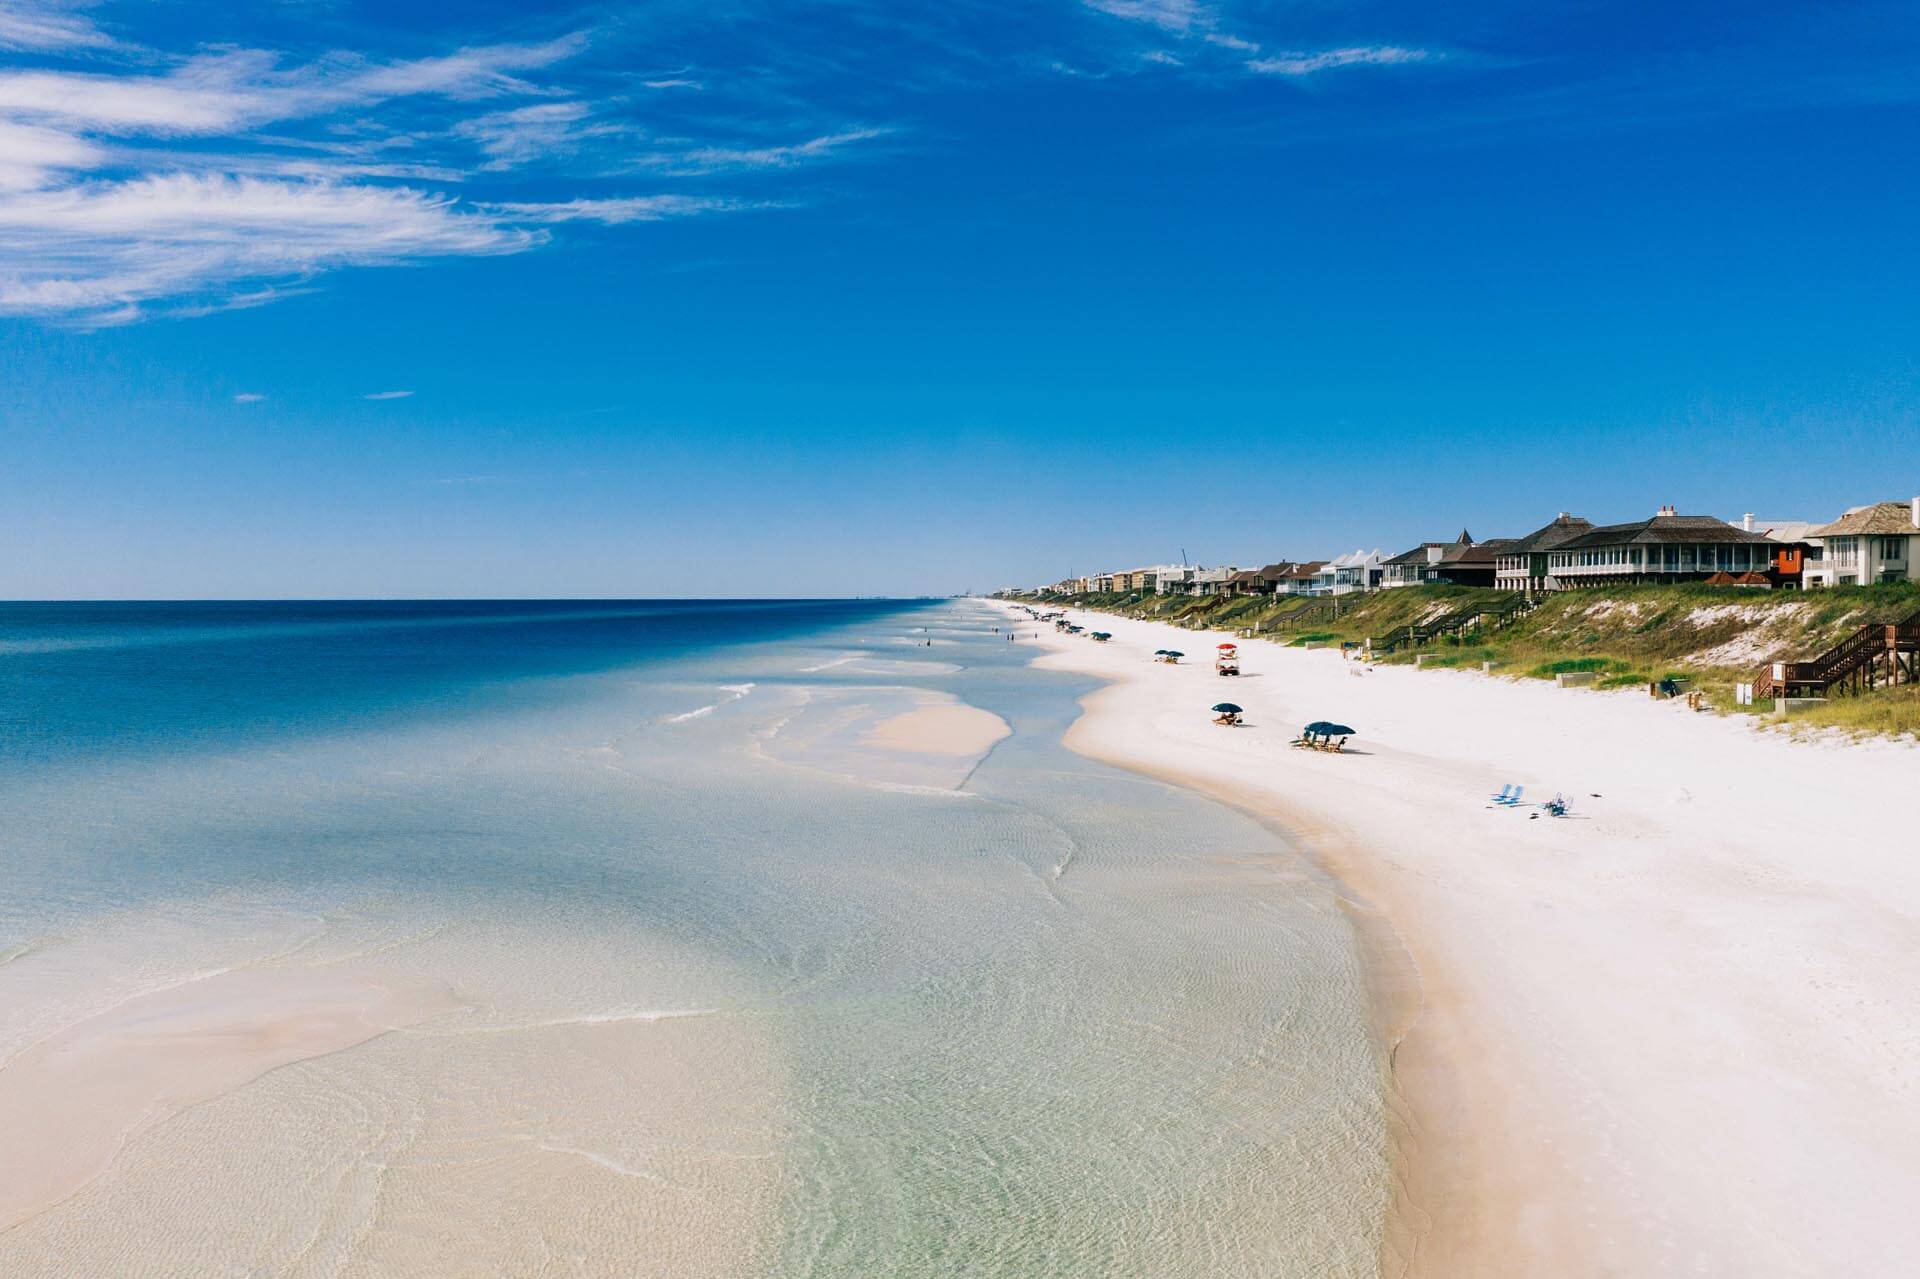
Gulf front means the property sits directly on the Gulf of Mexico. No road between you and the water. No lot, no structure, no buffer. The home is on the sand, guests walk out the back door to the beach, and the listing photographs accordingly.
That direct access drives real revenue advantages: higher peak-season ADR ceiling, earlier booking windows, and guest search filter dominance on Vrbo and Airbnb. Travelers who filter specifically for “beachfront” never see a gulf view property. That filter behavior alone removes a meaningful chunk of the high-demand booking pool from your gulf view competitor down the street.
The trade-off is real and it shows up on your insurance premium and maintenance budget. Storm surge exposure, wind damage risk, erosion vulnerability, and aggressive exterior maintenance schedules are all baked into gulf front ownership. Insurance costs on some St. George Island gulf front properties run significantly higher than comparable inland or across-the-road equivalents. That cost directly compresses net operating income, which is where cap rate lives.
Defining Gulf View on St. George Island
Gulf view means the property has a sight line to the Gulf — typically from elevated decks, second or third floors, or across a road — but does not sit directly on the beach. Here’s where buyers need to be rigorous: the quality of a “gulf view” varies enormously from listing to listing.
An unobstructed panoramic Gulf view from a rooftop deck on a 5-bedroom home with a private pool, 200 yards from a beach access point, performs very differently in the rental market than a partial sliver of blue water visible from one second-floor window. Both may say “gulf view” in the listing. Only one of them commands real premium ADR.
Key factors that preserve or erode gulf view rental value on St. George Island:
- View permanence — could a future structure obstruct the sightline?
- Beach access proximity — how far is the nearest crossover or public access?
- Pool quality and outdoor living space
- Overall property condition and bedroom count
- Listing photography — gulf view homes that photograph well close a significant portion of the demand gap with gulf front properties
The Variables That Actually Drive Gulf Front Rental Income on St. George Island
Beyond the physical definition of each property type, here’s what actually moves the revenue needle:
Guest search filter behavior. On both Vrbo and Airbnb, a meaningful percentage of travelers filter for beachfront or oceanfront accommodations. Gulf view properties are simply excluded from those results, regardless of how good the view actually is. That’s lost top-of-funnel exposure you can’t market your way out of.
Listing photography impact. Gulf front homes photograph dramatically. Aerial shots over the water, deck photos with the Gulf as the backdrop, beach-level images. That visual content drives higher click-through rates and more direct booking inquiries. Gulf view properties can close some of that gap with high-quality photography, but they rarely close it entirely.
Booking window and lead time. Current Key Data market intelligence for our managed properties on St. George Island shows an average booking window of 46 days in advance as of the October 2026 pull date. Gulf front properties with strong review profiles tend to capture earlier bookings and repeat guests — both of which stabilize annual revenue.
Pool presence. A gulf view property with a private pool, strong outdoor entertaining space, and clean beach access can close a substantial portion of the occupancy gap with gulf front competitors. The pool isn’t optional for a competitive gulf view rental on St. George Island — it’s table stakes.
Running the Numbers: St. George Island Gulf Front vs Gulf View ROI in 2026
Here’s where the rubber meets the road. Let’s look at what the data actually suggests for each property type.
Current Key Data Portfolio Performance — October 2026
Current Key Data market intelligence for our managed properties on St. George Island shows the following benchmarks as of the October 2026 pull date:
- Average Daily Rate (ADR): $307.69
- Adjusted Paid Occupancy: 42.7%
- RevPAR: $104.10
- Average Booking Window: 46 days in advance
- Average Length of Stay: 5.2 nights
ADR and occupancy are both down from the prior year — and that’s exactly the kind of market signal that creates favorable entry conditions for new buyers. You’re acquiring at a moment when revenue projections are being set conservatively and purchase prices reflect a softening demand environment. Buyers who get in now at negotiated prices are positioned to benefit when seasonal demand cycles back up.
Broader Market Benchmarks for St. George Island Vacation Rentals
Third-party market intelligence paints a picture of meaningful seasonal range. Peak season — May through July — shows occupancy around 61.9% and ADR near $566 per night, generating roughly $10,147 in monthly revenue. Gulf front properties with strong search visibility tend to hit the upper end of those ranges or exceed them.
Low season occupancy drops to approximately 31.2%, though ADR holds near $489. The seasonality on St. George Island is real and steep. Annual profitability depends far more on occupancy management and operating cost control than on peak-night rates alone.
Market-wide annual revenue per listing runs approximately $49,847. Here’s what that looks like at different purchase prices:
| Purchase Price | Gross Annual Revenue | Gross Yield (Before Expenses) |
|---|---|---|
| $800,000 | $49,847 | 6.2% |
| $1,000,000 | $49,847 | 5.0% |
| $1,200,000 | $49,847 | 4.2% |
| $1,500,000 | $49,847 | 3.3% |
These are gross yields — before management fees, cleaning, utilities, insurance, HOA dues, maintenance, taxes, and reserves. Depending on your operating expense ratio (typically 45%–55% of gross revenue for a professionally managed vacation rental), stabilized cap rates on St. George Island land somewhere in the 3%–5% range for most properties. Well-bought gulf view properties with efficient operations can push toward 5%–7%. An expensive gulf front home with high insurance, heavy maintenance, and soft occupancy can slip below 3%.
The Bottom Line on Gulf Front vs Gulf View ROI
Gulf front typically wins on absolute annual revenue — higher ADR ceiling, stronger search visibility, earlier booking capture. Gulf view can win on yield if the acquisition price is right, the property is well-configured for rentals, and operating costs are managed tightly.
The honest answer is this: a poorly bought gulf front property will underperform a well-bought gulf view property almost every time. The purchase price is where most St. George Island deals are made or broken, and right now the market is giving buyers the negotiating window to get that number right.
What to Verify Before You Close — St. George Island Investor Checklist
Franklin County recently allocated $600,000 in tourism development funds toward road paving and stormwater infrastructure on St. George Island. Improved roads and drainage can meaningfully support rental property access and visitor experience. Before closing, confirm whether a property sits near planned improvement areas and whether construction timing or future assessments affect your first-year numbers.
Beyond infrastructure, verify directly with Franklin County and relevant HOA or subdivision documents:
- Current short-term rental permissions and any pending restrictions
- Flood zone designation and elevation certificate
- Wind and flood insurance quotes — get actual numbers, not estimates
- Pool, dock, and dune alteration restrictions
- HOA rental restrictions or owner-use minimums
- Coastal construction setback requirements
On St. George Island, subdivision-level rental rules can completely change the investment case even when county zoning looks clean. Don’t skip this step.
Frequently Asked Questions
What is the average ROI on a St. George Island vacation rental in 2026?
Based on current market data, gross yields on St. George Island vacation rentals range from approximately 3.3% at a $1.5 million purchase price to 6.2% at $800,000, using a market-wide gross annual revenue benchmark of about $49,847. Stabilized cap rates — after management, insurance, maintenance, and operating expenses — typically fall in the 3%–5% range. Well-purchased gulf view properties with strong rental attributes can push toward 5%–7%.
Is a gulf front home on St. George Island worth the premium over a gulf view property?
It depends entirely on the price gap and the operating cost difference. Gulf front homes generate higher peak-season ADR and capture more search traffic on booking platforms, but they carry significantly higher insurance premiums, more aggressive maintenance schedules, and greater storm exposure. If the price gap between a gulf front and a comparable gulf view home is $300,000 or more, gulf view often delivers stronger yield — even if absolute revenue is lower.
How long does it take to sell a home on St. George Island in 2026?
Current market data shows homes taking 121–133 days to go to contract, with a sale-to-list ratio of approximately 94%–95%. That means buyers are typically closing at 5%–6% below asking price. On a $1.2 million listing, that’s $60,000–$72,000 in negotiating room — a material improvement to your day-one cap rate.
What is the peak rental season on St. George Island?
The strongest reported rental period is May through July, with market-wide occupancy near 61.9% and ADR around $566 per night. Spring break, summer beach demand, and holiday weeks drive the bulk of annual revenue. Low season occupancy drops to approximately 31.2%, though nightly rates remain near $489 — underscoring that annual profitability is driven by occupancy management, not just nightly rate.
Does Rent & Relax manage gulf front and gulf view properties on St. George Island?
Yes. Rent & Relax Vacation Rentals manages properties across both categories on St. George Island. Our current Key Data market intelligence — pulled October 2026 — reflects real portfolio performance from our managed properties on the island, including ADR, occupancy, RevPAR, booking window, and length-of-stay data. We can walk you through how specific properties in each category are actually performing before you make an offer.
Ready to Invest in St. George Island?
Whether you’re eyeing a gulf front home with direct beach access or a gulf view property with a better entry price and stronger yield potential, the most important move you can make right now is getting the real numbers — not the marketing pitch. The current market on St. George Island is giving serious buyers negotiating leverage they haven’t had in years. The window to use it is open right now.
Rent & Relax Vacation Rentals manages 100+ vacation rentals along Florida’s Emerald Coast, including properties on St. George Island. We know what’s renting, what’s sitting, and what the numbers actually look like behind the listing descriptions. Contact us today and let’s run the real ROI comparison on any property you’re considering — gulf front, gulf view, or anything in between.