Cape San Blas Vacation Rental Investment Guide: What the 2026 Numbers Actually Tell You
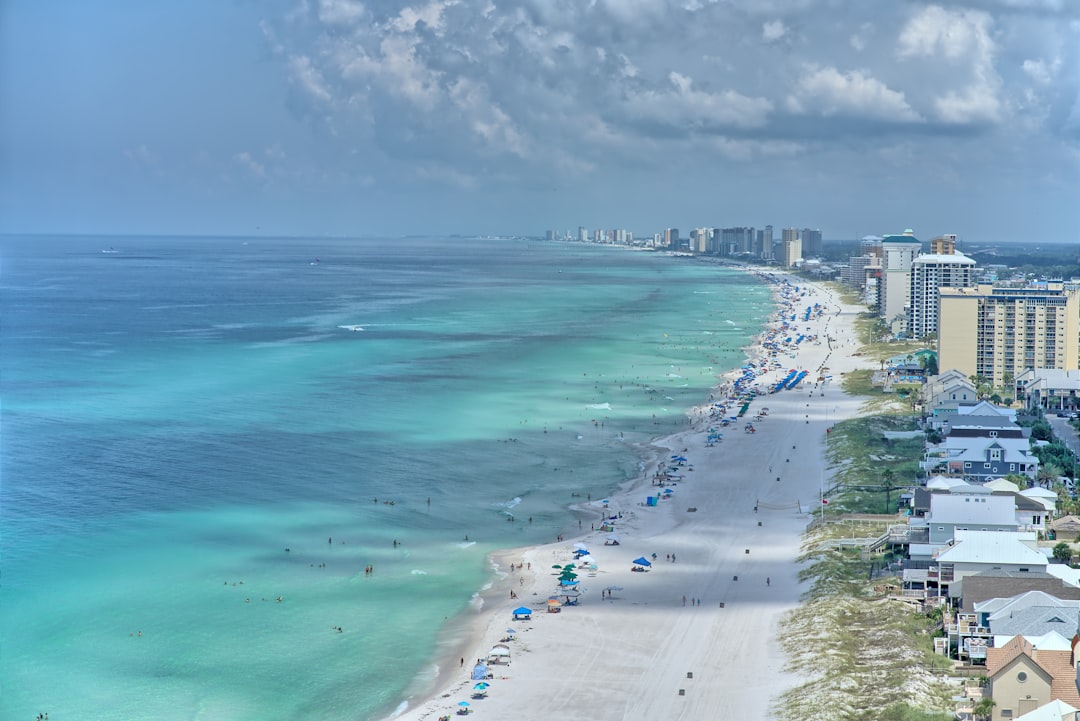
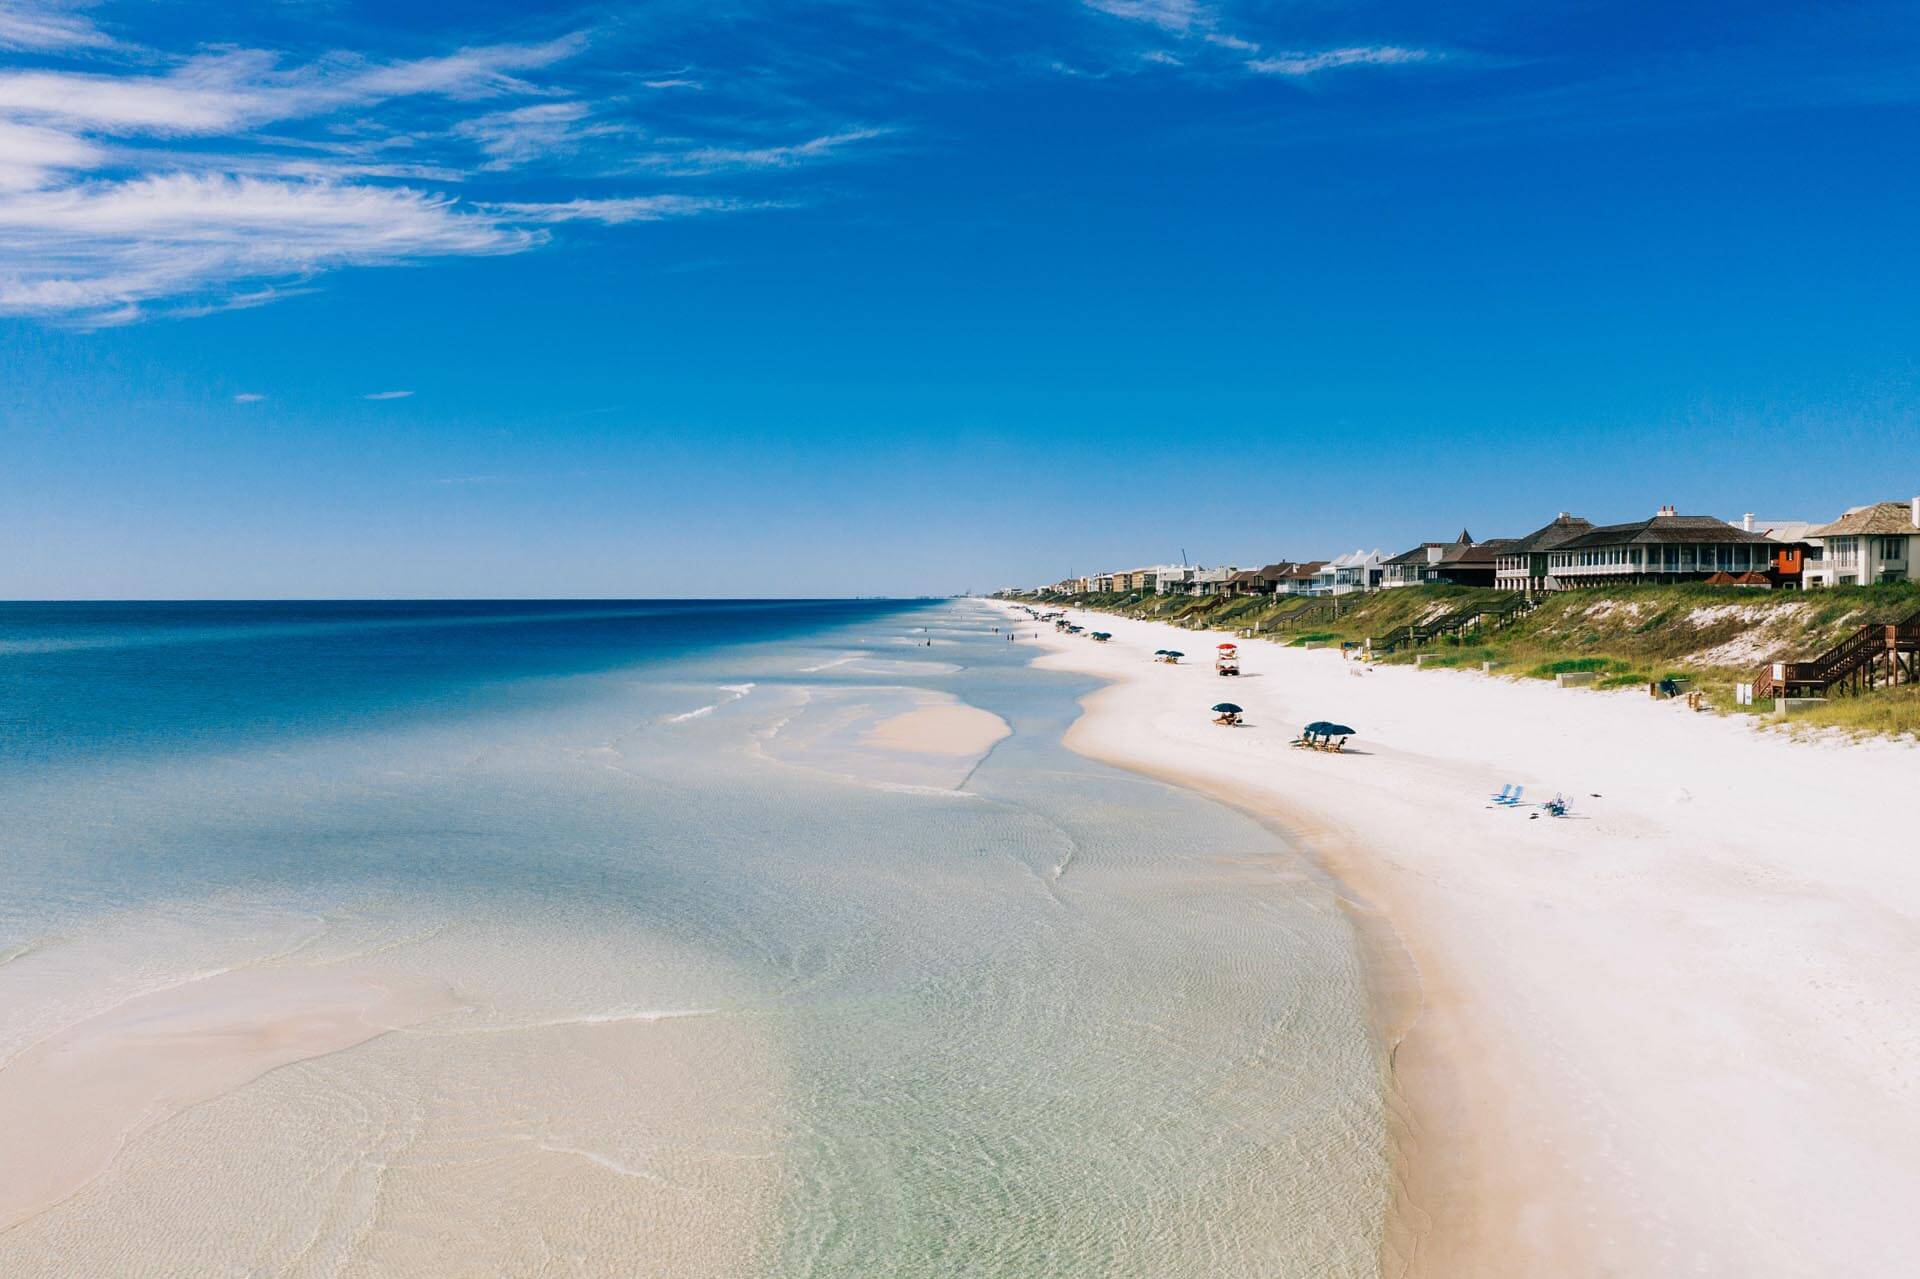
Picture a barrier peninsula where turquoise Gulf water meets miles of undeveloped coastline, buffered on the south by St. Joseph Peninsula State Park. Now look past the scenery. Behind that backdrop is one of the Florida Panhandle’s most interesting short-term rental markets — and right now, the numbers are moving in buyers’ favor. This cape san blas vacation rental investment guide pulls current Key Data market intelligence from our managed portfolio (August 2026 data pull), blends in AirROI and AirDNA market benchmarks, and gives you the straight story on what a Cape San Blas investment property can realistically produce in 2026.
We cover market performance data, seasonal patterns, gross revenue ranges, buyer cost considerations, and what a professional management strategy looks like on this peninsula. No fluff. Let’s get into it.
Is Cape San Blas a Good Place to Invest in a Vacation Rental?
The short answer is yes — with discipline. Cape San Blas vacation rental investment rewards buyers who underwrite conservatively, pick the right property type, and execute a multi-platform distribution strategy. It punishes buyers who benchmark against peak-year numbers or ignore insurance and HOA costs. Here’s the orientation you need before you write an offer.
What Makes Cape San Blas Different From Other Florida Panhandle Markets
Cape San Blas is a barrier peninsula. That matters for one simple reason: there is a hard ceiling on how much new inventory can enter this market. The southern end is permanently buffered by St. Joseph Peninsula State Park — no commercial sprawl, no new hotel corridors, no strip malls. What you see is largely what you get, and that supply constraint is a long-term structural argument for the market.
The guest profile here skews toward nature-focused families, repeat Gulf Coast visitors, and people who are specifically looking for something less commercialized than Destin or even 30A. These are not first-time beach-vacation tourists wandering in from a Google search. They are intentional travelers who chose Cape San Blas over a dozen other options. That loyalty tends to produce repeat bookings — and repeat bookings are one of the cleanest indicators of a healthy rental market.
One more thing buyers need to know about the property mix: Cape San Blas is dominated by entire homes and 3-plus-bedroom houses. AirROI data sourced via Perplexity shows 87 active Airbnb listings on the peninsula, and the overwhelming majority are detached homes. If you are underwriting a smaller condo or a non-beachfront unit, do not benchmark it against what the top beachfront homes are producing. The spread here is wide, and property-specific underwriting matters more than market averages.
The Seasonality Profile Every Buyer Needs to Understand
Cape San Blas runs hot in summer and quiet in winter. That is not a red flag — it is a planning variable. Every strong Gulf Coast market has a seasonality curve. The question is whether your reserve strategy and shoulder-season marketing can carry the slow months without bleeding cash.
Here is what the AirROI seasonal breakdown (sourced via Perplexity research) looks like in practice: peak season months — July, June, and March — average 50.2% occupancy and a $575 ADR. Low season months — January, November, and December — average 22.8% occupancy and a $513 ADR. July is the strongest revenue month on the peninsula. December is the weakest. That gap is meaningful and needs to be built into your annual revenue model from day one, not discovered after closing.
The takeaway for buyers: underwrite to the full-year blended number, not to summer alone. Build a 90-day operating reserve. And make sure your property management partner is running active pricing strategies in March, April, and October — the shoulder months where the difference between a well-managed and a poorly managed property shows up most clearly.
Cape San Blas Vacation Rental Market Data: August 2026 Snapshot
Here is where this cape san blas vacation rental guide gets specific. The figures below come directly from two sources: current Key Data market intelligence from our managed portfolio (August 2026 data pull) and Perplexity-sourced third-party benchmarks from AirROI and AirDNA. We are going to walk through each metric and tell you what it means for a buyer underwriting a purchase today.
Rent & Relax Managed Portfolio Performance — Key Data Figures
Average Daily Rate (ADR): $306.41 — This is down 25.1% from the prior year, per current Key Data market intelligence from our managed properties, August 2026 data pull. A softer ADR environment does two things for a buyer: it compresses competition from existing owners who may be exiting, and it gives you a more realistic underwriting floor. Buyers who pencil deals using peak ADR assumptions tend to be disappointed. Buyers who underwrite at today’s ADR and model conservative upside are positioned better when rates recover.
Adjusted Paid Occupancy: 47.5% — Down 3.4% from the prior year. Same logic applies here. If your deal works at 47.5% occupancy, it works. If it only works at 55%, you are banking on a recovery that may or may not arrive on your timeline. Stress-testing against current occupancy is conservative underwriting — and conservative underwriting is how you avoid getting hurt in a market like this.
RevPAR: $115.02 — Revenue per available rental day. This is the most useful single-number efficiency metric because it combines ADR and occupancy into one figure. It lets you compare properties with different pricing strategies on an apples-to-apples basis. A property running a high ADR with low occupancy and a property running a lower ADR with higher fill can produce similar RevPAR — but they have very different risk profiles. Know your RevPAR target before you close.
Average Booking Window: 43 days — Guests are booking roughly six weeks out. That is shorter than prior-year patterns, which aligns with the Q2 2025 market report note (sourced via Perplexity) that guests are booking closer to their stay dates than the year before. For owners, this means last-minute pricing strategy and dynamic rate management are not optional — they are the difference between filling your calendar and leaving nights dark. Your management partner needs to be actively adjusting rates inside that 43-day window.
Average Length of Stay: 5.2 nights — Slightly above a standard midweek split, slightly below a full week. From an operations standpoint, this is favorable. Fewer turnovers per month means lower cleaning costs and less wear on the property. From a revenue standpoint, it also suggests guests are committing to meaningful stays rather than quick weekend trips.
How Cape San Blas Compares to Broader Market Benchmarks
AirROI data for Cape San Blas (sourced via Perplexity) shows 87 active Airbnb listings, $42,133 average annual revenue, 32.4% occupancy, a $566 ADR, and $195 RevPAR. AirDNA’s broader Port St. Joe market data for June 2026 (sourced via Perplexity) shows 2,636 active STR listings across the area, $43.8K average annual revenue, 54% annual occupancy, a $505 ADR, and $274 RevPAR.
The number that should jump out at you is the occupancy gap: 32.4% Airbnb-only versus 54% blended Airbnb-plus-Vrbo. That 21-plus-point spread is not noise. It is a direct argument for multi-channel distribution. If your property is only listed on one platform, you are leaving occupancy — and revenue — on the table. A management partner running active listings across Airbnb, Vrbo, and direct booking channels will materially outperform a single-platform strategy in a market like Cape San Blas.
What Does a Cape San Blas Vacation Rental Investment Actually Return?
Let’s talk numbers in a way you can use to underwrite a deal. The cape san blas airbnb and broader STR data points to a gross annual revenue range of $42,133 to $43,800 for the average active listing, based on AirROI and AirDNA figures sourced via Perplexity.
Gross Revenue Ranges and Cap Rate Proxies
Against a $710,000 acquisition price, $42,133 in gross annual revenue produces a rough gross yield of approximately 5.9%. Against an $850,000 basis, you are looking at closer to 5.0% gross. These are revenue-to-price estimates — not true cap rates — because they do not subtract management fees, insurance, HOA, property taxes, maintenance, or financing costs. Run your actual net numbers before you commit.
One more figure worth knowing: AirROI data (sourced via Perplexity) shows the top 10% of Cape San Blas listings produce $150,000 or more annually, while the bottom quartile produces around $28,000. That $122,000 spread between the best and worst performers tells you that property selection and management quality are far more important than market averages. The market average does not close your mortgage — your specific property’s performance does.
Buyer Cost Considerations You Cannot Ignore
Three cost categories will make or break the net yield on a Cape San Blas investment property, and none of them show up in gross revenue benchmarks.
Insurance: On a barrier peninsula, windstorm and flood coverage are not optional line items. They are among the largest recurring expenses you will carry, and they can compress your net yield significantly. Get actual insurance quotes for any property you are seriously considering before you finalize your underwriting. A $42,000 gross revenue property with $18,000 in annual insurance costs is a very different investment than it looks on the surface.
HOA fees: These vary sharply by complex, beachfront access, pool and amenity maintenance, and how the association structures its reserves. There is no reliable peninsula-wide average because the range is too wide. Ask for the full HOA fee schedule and the most recent reserve study before you make an offer. A beachfront complex with a pool, dune boardwalk, and elevator maintenance can run significantly higher than an inland community.
Financing: Most Cape San Blas purchases are second-home or investment property acquisitions. Lenders underwrite these more conservatively than primary residences. Plan for a larger down payment, a higher rate, and stricter cash-flow coverage requirements. The market’s December weakness and summer concentration make operating reserves non-negotiable — lenders who finance STR properties know this, and the smart ones will tell you to hold three months of carrying costs in liquid reserves before you close.
Real Estate Market Context: What Are Properties Actually Selling For?
Realtor.com data (sourced via Perplexity) shows a median home price in the range of $445,900 to $664,950 depending on the source date and how the median is defined — May 2026 data cited a median listing price of $664,950 with 767 active listings and 84 days on market, while the Realtor.com local market page shows $445,900 with 880 listings and 123 days on market. Both sources point to elevated inventory and meaningful time on market. That is a buyer’s negotiating environment, not a seller’s.
The Q2 2025 market report for the Mexico Beach, Port St. Joe, and Cape San Blas area (sourced via Perplexity) noted that average days on market were approximately 20 days higher than in 2024 and that the average list-to-sell ratio was around 92%. In plain terms: sellers are taking less than ask, and properties are sitting longer. For a disciplined buyer with solid underwriting, that is a favorable setup to enter a market that has real structural supply constraints and a proven summer demand base.
Frequently Asked Questions
How much can a Cape San Blas vacation rental actually earn per year?
Based on AirROI and AirDNA data sourced via Perplexity research, average active listings on the peninsula generate between $42,133 and $43,800 in gross annual revenue. The range is wide — the top 10% of performers hit $150,000 or more annually, while the bottom quartile comes in around $28,000. Beachfront access, bedroom count, amenities, and management strategy are the biggest variables driving where a specific property lands in that range.
Is Cape San Blas too seasonal to cash flow year-round?
It is a high-seasonality market, but that does not mean it cannot cash flow year-round. It means you need to plan for it. Peak months — July, June, and March — average 50.2% occupancy and a $575 ADR. Low months — January, November, and December — average 22.8% occupancy. A strong shoulder-season marketing strategy, dynamic pricing inside the 43-day booking window, and a 90-day operating reserve are the tools that separate properties that cash flow annually from those that don’t.
What should I know about insurance costs before buying in Cape San Blas?
Insurance is one of the most significant recurring expenses on a barrier peninsula and one of the most frequently underestimated by buyers who focus only on gross revenue benchmarks. Windstorm and flood coverage are standard requirements, and premiums can materially compress your net yield. Get actual quotes for any specific property before finalizing your underwriting — do not estimate from a general Florida coastal average.
Does listing on Airbnb alone work in Cape San Blas?
The data says no. AirROI figures for the peninsula (sourced via Perplexity) show 32.4% occupancy for Airbnb-only operators. Blended Airbnb-plus-Vrbo occupancy for the same market comes in at 54% — a 21-plus-point gap. Multi-platform distribution is not a bonus strategy here. It is the baseline for competitive performance.
Are Cape San Blas home prices still negotiable in 2026?
Yes. The Q2 market report for the area (sourced via Perplexity) showed a list-to-sell ratio of approximately 92% and days on market running about 20 days higher than 2024 levels. Active inventory is elevated, properties are sitting longer, and sellers are negotiating. That combination gives a prepared buyer real leverage — as long as your underwriting is grounded in current performance data, not peak-year projections.
Ready to Invest in Cape San Blas?
Rent & Relax Vacation Rentals manages 100-plus properties along Florida’s Emerald Coast, including an active Cape San Blas portfolio. We run multi-platform distribution, dynamic pricing, and active shoulder-season marketing — the exact strategy that closes the gap between 32% Airbnb-only occupancy and 54% blended performance. If you are seriously underwriting a Cape San Blas vacation rental purchase, talk to us before you close. We can walk you through real portfolio performance numbers, introduce you to local real estate contacts, and tell you honestly whether a specific property fits what we see working in this market. Reach out to the Rent & Relax team today — no obligation, just straight answers.