Cape San Blas Best Properties for Cash Flow: A Data-Driven Investor’s Guide
If you’ve been watching headlines about the Florida Panhandle real estate market, you’ve probably seen a lot of hand-wringing about softening prices and rising inventory. Here’s the thing — for investors hunting the cape san blas best properties for cash flow, that “bad news” is actually the setup you’ve been waiting for. More inventory, longer days on market, and moderating prices don’t spell trouble. They spell negotiating power. And right now, Cape San Blas has all three.
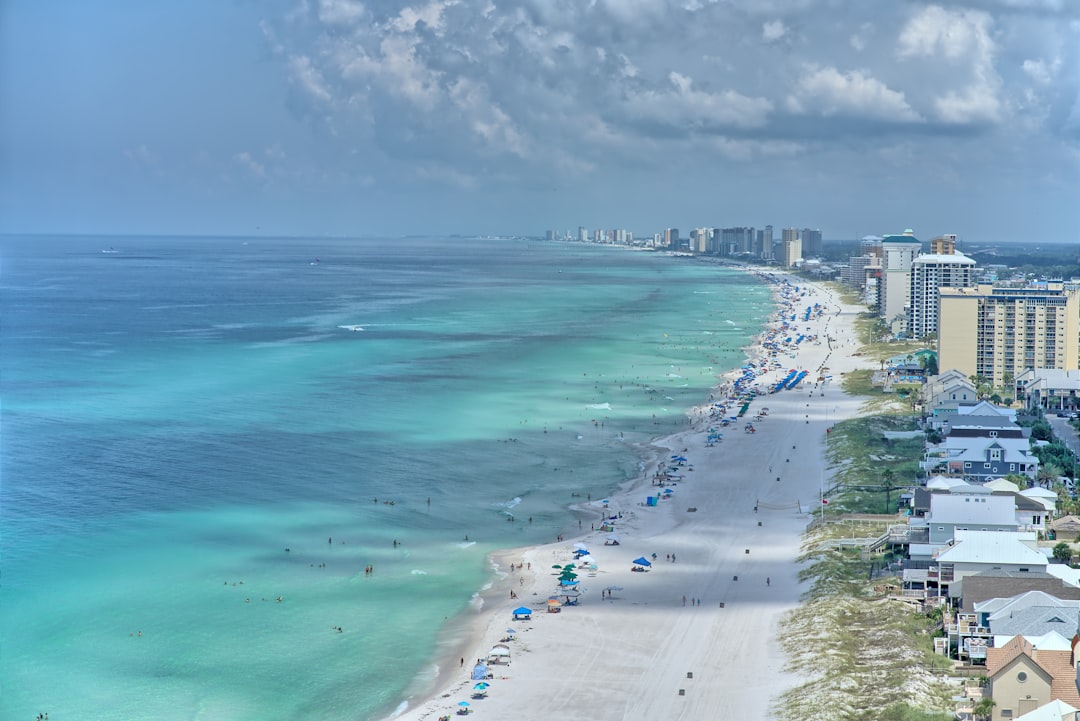
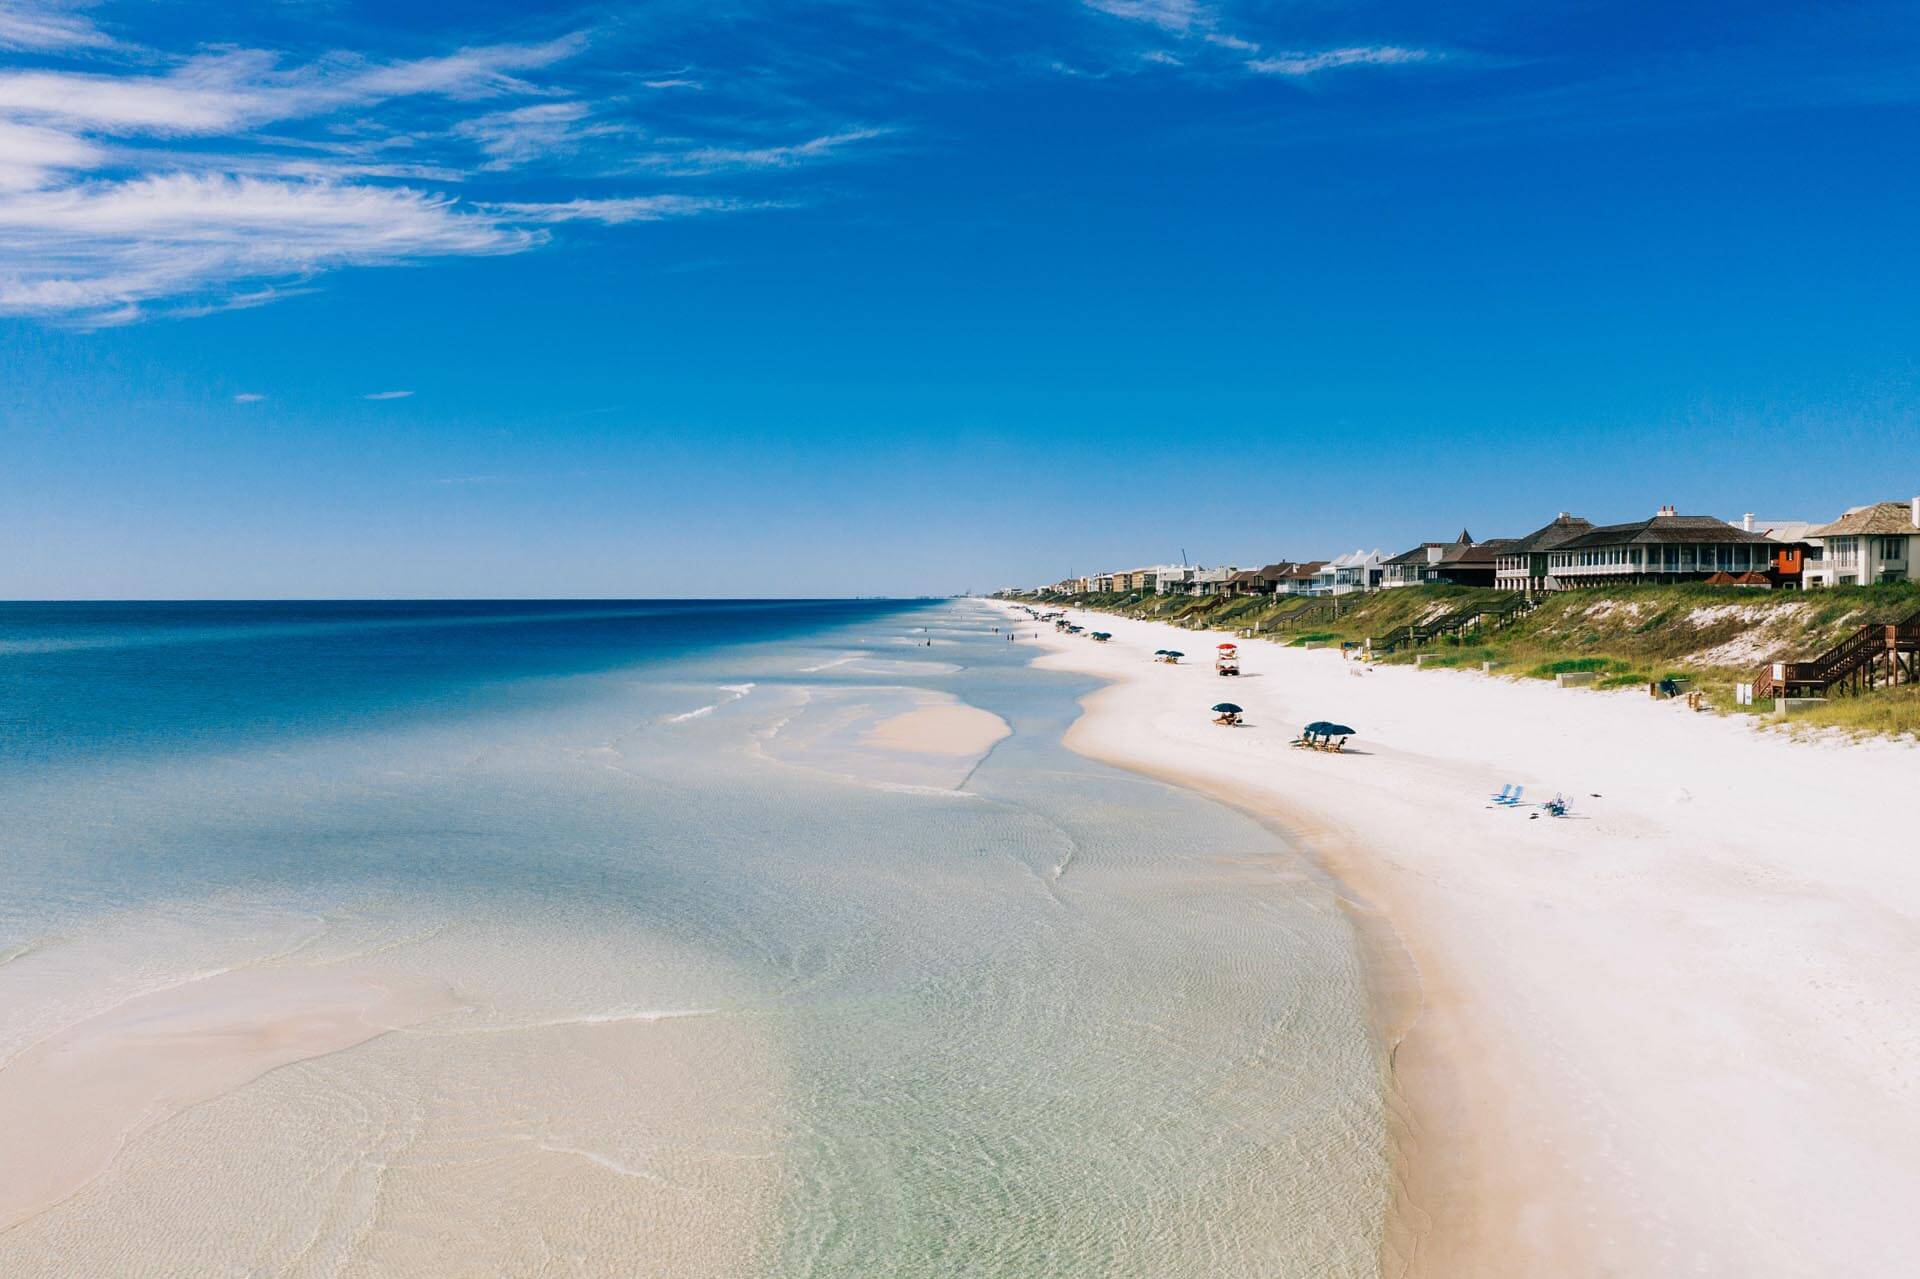
Cape San Blas is a 21-mile barrier peninsula tucked into Gulf County on Florida’s Forgotten Coast. No high-rises. No chain hotels. Dog-friendly beaches, state park access, and water so clear and shallow it makes Destin look like a crowded parking lot. The STR regulatory environment in Gulf County remains relatively permissive compared to more congested Panhandle markets — which means your rental business isn’t one city commission vote away from a headache.
This guide breaks down exactly which property types, price tiers, and performance benchmarks define the Cape San Blas best properties for cash flow — backed by current Key Data market intelligence pulled August 2026 from Rent & Relax Vacation Rentals’ managed portfolio and independent market research on competitor properties.
What you’ll learn in this guide:
- Why the current market correction is a buyer entry point, not a warning sign
- Actual rental performance numbers from our managed Cape San Blas portfolio (Key Data, August 2026)
- How competitor properties are performing across occupancy, ADR, and annual revenue
- Which property types and price tiers produce the strongest cash flow
- What conservative underwriting looks like for Cape San Blas in 2026
Why Cape San Blas Is a Cash-Flow Market Worth Understanding Right Now
Most investors chase momentum. They buy when everything looks great, prices are climbing, and every listing gets multiple offers in 48 hours. That’s also when you overpay, your cap rate is thin, and your margin for error is zero. The investors who build real wealth buy when the market gives them room to breathe. Cape San Blas is giving investors room to breathe right now.
A Market Built on Scarcity and Natural Appeal
Supply constraints on Cape San Blas are structural, not cyclical. Strict coastal setback rules, state park land on both sides of the peninsula, and a no-chain-hotel culture mean the inventory of rentable properties is genuinely limited. You can’t just build your way out of demand here the way developers can in inland markets.
The guest profile matters too. Cape San Blas draws a loyal return-visitor demographic — families who come back every summer, couples celebrating anniversaries, groups who bring their dogs because the beach actually welcomes them. That repeat-booking behavior stabilizes your occupancy baseline in ways that trendy new destinations can’t replicate. For cape san blas vacation rental investors, that loyalty translates to direct bookings, lower platform dependency, and more predictable revenue modeling.
Gulf County’s STR regulatory environment also remains meaningfully more permissive than markets like Walton County (30A) and Bay County (Panama City Beach), where short-term rental rules have tightened significantly. If cape san blas real estate is on your radar, the regulatory picture is one of the strongest reasons to act sooner rather than later.
What the 2025–2026 Market Data Actually Tells Investors
Let’s look at the numbers directly, because the story they tell is different from what the headlines suggest.
Median home sale price in Gulf County is currently sitting at approximately $445,900, down 6.53% year-over-year (Realtor.com). Price per square foot is running at $387, down 11.63% YoY — but here’s the number that matters for long-term investors: that same price per square foot is still up 16.54% over three years. Short-term correction inside a long-term appreciation trend is not a red flag. It’s a buying window.
Active listings are up 17.06% year-over-year at approximately 880 units. Average days on market is running between 104 and 151 days depending on the data source and sub-segment. For context, the residential inventory specifically within the Cape San Blas and Indian Pass corridor has been fluctuating around 140–147 homes during summer 2026.
One important distinction: full-year 2025 MLS data shows an average residential sale price of approximately $1,034,278 and a median of $821,000. Those numbers are skewed upward by Gulf-front and luxury inventory. If you’re underwriting a cash-flow property in the $500K–$750K range, you’re operating in a different segment than those averages reflect.
The bottom line: this is a moderating market with more selection, longer due-diligence windows, and motivated sellers. That combination is exactly where the cape san blas best properties for cash flow are found — not at the top of a cycle, but in the correction that follows one.
Cape San Blas Vacation Rental Performance — What the Numbers Show
Data is where this gets real. Let’s separate two distinct sources: our managed portfolio numbers from Key Data, and independent market research on competitor properties. Both matter for underwriting. Neither should be confused with the other.
Our Managed Portfolio Performance (Key Data, August 2026)
For the cape san blas best properties for cash flow analysis, the most reliable baseline comes from properties we actually manage. Here’s what current Key Data market intelligence figures show for our managed properties as of the August 2026 pull date:
- Average Daily Rate (ADR): $306.21 — down 24.8% from last year
- Adjusted Paid Occupancy: 47.7% — down 4.4% from last year
- RevPAR: $115.29
- Average Booking Window: 43 days in advance
- Average Length of Stay: 5.2 nights
Here’s how to read these numbers as a buyer. The ADR and occupancy pullbacks mean you are looking at a market trough, not a market peak. Properties acquired today carry a lower cost basis relative to where ADR was 12–18 months ago — and relative to where it is likely headed as the market normalizes. Buying at the trough with a lower purchase price and a lower ADR baseline gives you two potential upside levers simultaneously: appreciation and revenue recovery.
A RevPAR of $115.29 is a clean, conservative modeling number. At 365 available nights, that puts gross revenue potential around $42,000 annually at the portfolio average — before any optimization, dynamic pricing improvements, or property-specific performance factors.
The 5.2-night average length of stay is worth noting separately. Longer stays mean fewer turnovers per booking cycle. Fewer turnovers mean lower cleaning costs, lower operational friction, and better net margins. For cape san blas rental income modeling, that directly improves your bottom line without changing your ADR at all.
The 43-day average booking window tells you guests are planning about six weeks out. That’s actionable for dynamic pricing strategy — you know when to hold firm on rates and when to nudge for last-minute fills.
How Competitor Properties Are Performing (Independent Market Research)
The following figures come from independent market research on competitor properties — not our managed portfolio. This distinction matters for a complete picture of the Cape San Blas vacation rental investment landscape.
One critical framing point before diving in: Airbnb-only occupancy figures dramatically understate true performance on Cape San Blas. Many Cape properties rely heavily on Vrbo, direct bookings, and regional listing sites. Airbnb-only data shows occupancy around 32–32.4%. Blended Airbnb plus Vrbo occupancy across the market runs approximately 50–54% annually with about 4% year-over-year growth in recent data. If someone hands you an Airbnb-only occupancy figure and calls it the market average, they’re showing you half the picture.
Competitor ADR benchmarks from AirROI data break down like this:
- Overall market ADR: approximately $566/night
- Median performers: approximately $464/night
- Top 25%: approximately $676/night
- Top 10%: $859+/night
Average annual revenue per competitor listing runs approximately $42,133, with a RevPAR of approximately $195 according to AirROI data. Peak season — primarily June, July, and March — produces monthly revenues around $9,470 per listing at roughly 50% occupancy and ADRs pushing $610–$614/night. Shoulder season drops to approximately $5,691/month. Low season (January, November, December) brings in around $3,772/month.
At the high end, one Gulf-front luxury listing tracked in AirROI’s Port St. Joe market data produced $243,831 in annual revenue at 54.6% occupancy and an ADR of $1,081/night. That’s not your baseline underwriting number — but it illustrates what the ceiling looks like when the right property is managed well.
Properties that underperform tend to share the same profile: ADR in the $450–$500 range, occupancy in the mid-30s, and annual revenue between $28,000 and $35,000. The gap between a well-managed property and a poorly marketed one on Cape San Blas is not small.
Which Property Types Produce the Best Cape San Blas Cash Flow
Not every property on the Cape performs equally. Here’s what the data consistently points to for strong cape san blas real estate cash flow:
Gulf-Front and Near-Gulf Homes with Private Pools
Four- to five-bedroom Gulf-front or near-Gulf homes with private pools and hot tubs consistently land in the top performance tiers. These are the properties commanding ADR in the $600–$850+ range during peak season with 50%+ annual occupancy. The capital requirements are higher — expect to underwrite at $800,000 to $1.5 million for true Gulf-front product — but the revenue ceiling justifies it when you model conservatively.
Three- to Four-Bedroom Canal or Second-Tier Gulf Access Properties
For buyers in the $500,000–$750,000 range, second-tier Gulf access properties and canal-front homes with bay views represent the strongest cash flow per dollar invested on the Cape right now. You’re giving up the premium Gulf-front ADR, but your acquisition cost is meaningfully lower, which often produces better actual returns when you run the math on net cash flow versus purchase price.
Properties with Dog-Friendly Features
Cape San Blas’s dog-friendly beach reputation is a legitimate marketing differentiator. Properties that lean into this — fenced yards, outdoor showers, proximity to the state park — consistently outperform comparable properties that don’t. It’s a low-cost way to expand your addressable guest market and reduce vacancy during shoulder season.
Conservative Underwriting for Cape San Blas in 2026
If you’re building a pro forma right now, here’s a reasonable conservative framework based on current Key Data market intelligence from our August 2026 managed portfolio data and independent market research:
- ADR baseline: $306–$400/night (conservative to moderate, based on property type)
- Annual occupancy: 47–54% blended across all platforms
- Annual gross revenue baseline: $38,000–$55,000 for a well-positioned 3–4 bedroom property
- Average stay: 5+ nights, reducing turnover costs
- Management fee: Budget 20–30% depending on full-service vs. partial management
- Expense ratio: Model 40–50% of gross revenue for total operating expenses including management, maintenance, insurance, and taxes
These are not optimistic numbers. They’re designed to survive a below-average year. If you can make the math work at conservative projections, the upside from ADR recovery and occupancy normalization is gravy — not the business plan.
Frequently Asked Questions
What makes Cape San Blas different from other Florida Panhandle vacation rental markets?
Three things: supply constraints, regulatory environment, and guest loyalty. Cape San Blas has no high-rise development, no chain hotels, and strict coastal setback rules that permanently limit how many rentable properties can exist. Gulf County’s STR regulations are more permissive than Walton County or Bay County. And the Cape draws a high percentage of repeat visitors — families and couples who come back year after year — which stabilizes occupancy and supports direct booking channels. For a gulf front vacation rental florida panhandle investor, that combination is hard to find anywhere else at this price point.
Is now a good time to buy a Cape San Blas investment property?
The data says yes for disciplined, conservative buyers. Median prices are down 6.53% year-over-year. Days on market are running 104–151 days, giving you real due-diligence time. Inventory is up 17% year-over-year, meaning you have selection and negotiating leverage. At the same time, the three-year price per square foot trend is still up 16.54%, which tells you this is a cyclical correction inside a longer appreciation trend. That’s the environment where cash-flow investors build equity without overpaying.
What annual revenue should I realistically expect from a Cape San Blas vacation rental?
Conservative baseline for a well-positioned 3–4 bedroom property in 2026: $38,000–$55,000 in gross annual revenue. Our managed properties show a RevPAR of $115.29 per current Key Data market intelligence (August 2026 pull). Competitor market data from AirROI shows average annual revenue per listing around $42,133, with top-performing properties clearing $80,000–$100,000+. Gulf-front luxury homes with pools and strong marketing can reach well above that — one AirROI-tracked listing hit $243,831 annually. Your number depends heavily on property type, location tier, management quality, and platform distribution strategy.
Should I use Airbnb occupancy data to underwrite a Cape San Blas rental?
No — not as your primary metric. Airbnb-only occupancy on Cape San Blas runs around 32–32.4%. Blended Airbnb plus Vrbo occupancy across the market is closer to 50–54%. Cape San Blas guests skew heavily toward Vrbo, direct bookings, and regional platforms. If you underwrite on Airbnb-only data, you’ll significantly underestimate revenue potential and potentially pass on properties that actually cash flow well. Always ask about the full platform distribution mix before building your pro forma.
What property management fees should I budget for Cape San Blas?
Budget 20–30% of gross rental revenue for full-service property management, which typically includes listing management, dynamic pricing, guest communication, housekeeping coordination, and maintenance oversight. At Rent & Relax, our Cape San Blas managed properties benefit from multi-platform distribution across Airbnb, Vrbo, and direct booking channels — which is a primary reason blended occupancy outperforms Airbnb-only figures by 15–20 percentage points. That distribution gap directly affects your bottom line.
Ready to Invest in Cape San Blas?
The cape san blas best properties for cash flow don’t sit on the market long once the right buyers find them — and right now, the market is giving disciplined investors the time and leverage to find them right. Lower prices, more inventory, and a loyal guest base that keeps coming back year after year. That’s a combination worth acting on.
At Rent & Relax Vacation Rentals, we manage 100+ properties along Florida’s Emerald Coast, including an active Cape San Blas portfolio. We know which properties perform, which ones underperform and why, and how to close the gap between the two. If you’re evaluating a Cape San Blas investment property — or just want to run the numbers on a specific listing — reach out to our team. We’ll give you straight talk, real data, and no corporate fluff.
Contact Rent & Relax Vacation Rentals today to talk through your Cape San Blas investment strategy with a team that actually manages properties there.