Cape San Blas Best Neighborhoods for Investors: A 2026 Data-Driven Buyer’s Guide
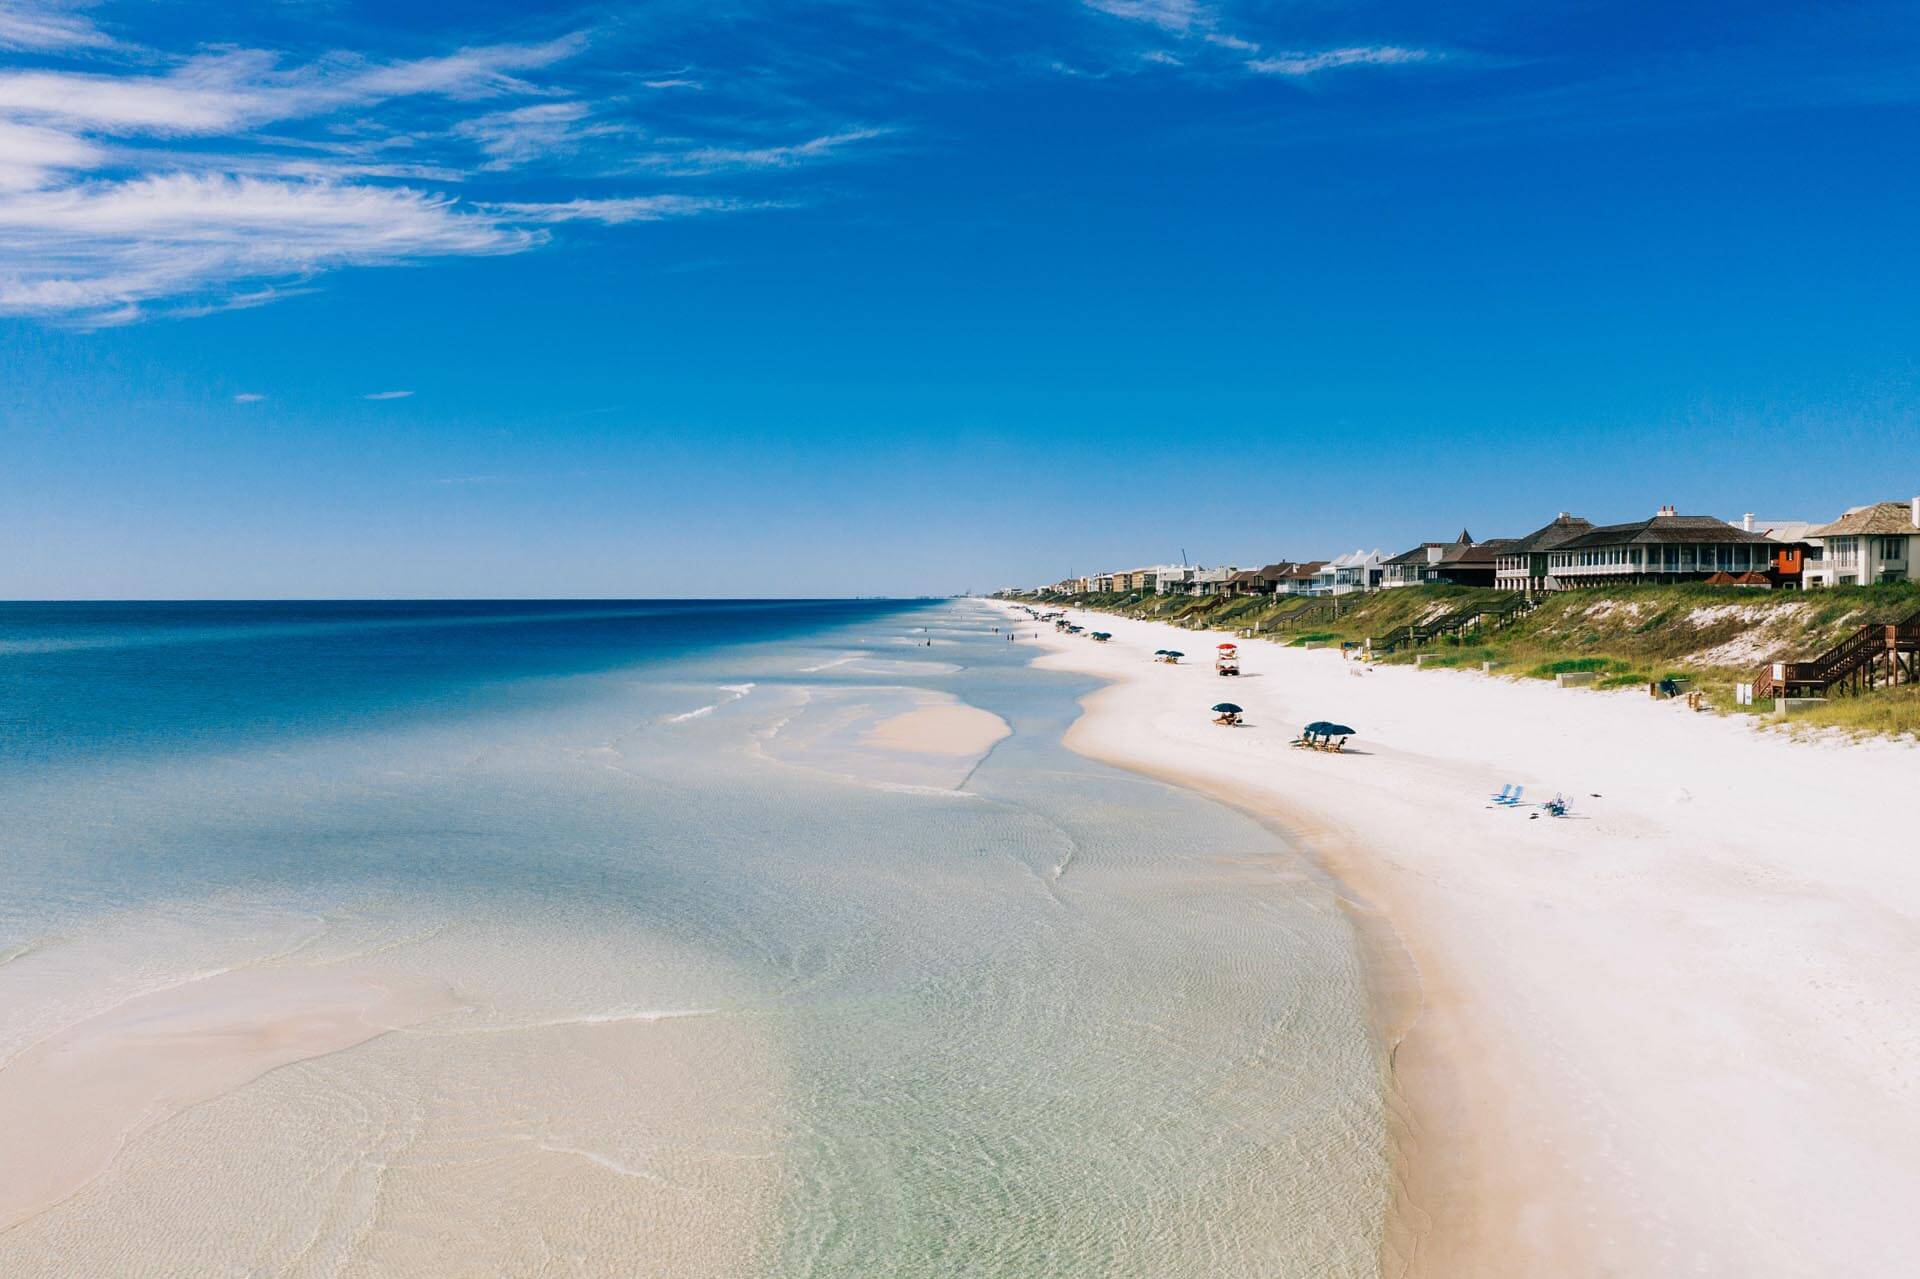
If you’re researching the cape san blas best neighborhoods for investors, you’ve probably already noticed this market doesn’t look like anything else on Florida’s Gulf Coast. No high-rises. No packed boardwalks. Just 20-plus miles of state-protected coastline, sugar-white sand, and a short-term rental market that keeps pulling in serious buyers who know what they’re looking at. As of August 2026, our managed properties are sitting at an ADR of $306.26 and adjusted paid occupancy of 47.7% — both down from prior-year peaks, which means buyers entering now are doing so at a meaningful discount to the revenue environment that justified those peak purchase prices. That’s not a warning. That’s the pitch.
This guide breaks down Cape San Blas by location tier — Gulf-front, Gulf-view, bay-side, and interior — because that’s how this market actually works. There are no named neighborhoods here the way you’d find in a suburban or urban market. Where you sit relative to the water determines your rate card, your insurance cost, your flood zone, and your ROI. Let’s get into it.
Why Cape San Blas Remains One of Florida’s Best STR Markets in 2026
The Market Fundamentals Every Cape San Blas Investor Needs to Know
Any serious Cape San Blas investor should understand that the broader MLS median — roughly $438,850 to $445,900 per current Realtor.com figures — is blended across a wide mix of product types. Inland lots, bay-side cottages, and smaller non-rental properties pull that number down. True vacation-rental-grade inventory on Cape San Blas — Gulf-front or Gulf-view houses that actually generate meaningful STR income — trades between $650,000 and $1,200,000-plus. That’s the range you need to underwrite against.
The median residential sales price eased from approximately $870,000 in 2024 to approximately $821,000 in 2025, with average pricing around $1.03 million. That’s not a distressed market. That’s price normalization after a few years of compressed supply and peak buyer demand — and it creates a cleaner entry point for investors who missed the 2021 and 2022 window.
Days on market tell the same story. Cape San Blas residential listings averaged 36 days on market in 2022. By 2024, that number had climbed to 107 days. In 2025 and into 2026, it’s running between 119 and 151 days depending on the data source. For most investors, that sounds like a problem. It’s actually the opposite. When well-priced inventory sits on the market for three to five months, sellers get motivated. Prepared buyers with financing in place and a clear investment thesis can negotiate. That’s leverage — the kind that doesn’t exist in a 2022-style bidding war.
What the Short-Term Rental Numbers Actually Look Like Right Now
Here’s what current Key Data market intelligence is showing for our managed properties as of the August 2026 pull date:
- ADR: $306.26
- Adjusted Paid Occupancy: 47.7%
- RevPAR: $115.22
- Average Booking Window: 43 days in advance
- Average Length of Stay: 5.2 nights
The ADR is down 25% from prior-year peaks, and occupancy is down 3.8%. Both of those figures reflect a market that corrected after pandemic-era highs — not a market in structural decline. Competitor houses in prime Cape San Blas Gulf-front and Gulf-view positions are achieving $500 to $600 ADR in peak months and $400-plus on a full-year blended basis, according to Perplexity research data pulling from STR analytics platforms. Blended Airbnb and Vrbo occupancy for the broader Cape San Blas market runs approximately 50 to 54 percent annually.
Seasonality here is real and predictable. High season runs late spring through summer — March through July — when weekly stays dominate and ADR peaks around $610 to $614. Shoulder seasons in spring and fall deliver moderate but genuine revenue, with occupancy around 37 percent. Low season from November through February drops occupancy into the low-20-percent range. Minimum-stay strategies and proactive shoulder-season marketing make a meaningful difference in how those off-peak months pencil out.
“Our managed properties are generating a RevPAR of $115.22 as of August 2026 — and with ADR down 25% from prior-year peaks, buyers entering this market now are purchasing at a meaningful discount to the revenue environment that justified peak purchase prices.”
Understanding Cape San Blas Neighborhood Types — How This Market Is Actually Organized
The cape san blas best neighborhoods for investors aren’t organized the way other markets are. There are no gated communities with brand names, no historic districts, no zip-code-specific price premiums. What drives investor performance on Cape San Blas is location tier. Here are the four that matter.
Location Tier 1 — Gulf-Front Properties
Gulf-front is the top of the rate card — full stop. These are the properties where peak ADR in the $610-plus range is achievable, where guests pay a premium specifically for the unobstructed Gulf view and direct beach access, and where weekly bookings fill in fastest during high season. If you’re buying a Gulf-front house at the right price on Cape San Blas and managing it correctly, this is as strong a rental asset as the Emerald Coast produces in this price range.
The underwriting catch: flood zone designation is almost always AE or VE on Gulf-front parcels, and wind and flood insurance costs have risen substantially over the past three years. Before you fall in love with a Gulf-front listing, model your insurance costs carefully. They can run $15,000 to $25,000 or more annually on a mid-range Gulf-front house, and that number changes your cash flow story significantly.
Beach erosion has historically been a concern on portions of the cape — which makes the $34.5 million beach nourishment and breakwater project a direct value event for Gulf-front owners. Gulf County secured $24 million in grant funding plus additional contributions to fund this project. For Gulf-front buyers closing in 2026, that infrastructure investment is a long-term floor under the asset. It’s the kind of public investment that protects and enhances the primary revenue driver — the beach itself.
Location Tier 2 — Gulf-View Properties
Gulf-view properties — typically one to three rows back from the water — represent the sweet spot for a lot of investors. Acquisition cost is meaningfully lower than Gulf-front, often by $100,000 to $300,000 or more depending on the specific parcel, while ADR remains strong. Guests booking Cape San Blas are largely drive-to family groups who care deeply about proximity to the beach. A short walk across the street or down a path to deeded beach access clears most of that demand threshold.
Flood zone designations on Gulf-view properties are often more favorable than Gulf-front — sometimes X or AE with lower base flood elevations — which can translate to meaningfully lower insurance premiums. That margin improvement on the carrying cost side, combined with a lower acquisition price, often produces better cash-on-cash returns than Gulf-front even with a slightly lower ADR ceiling.
This is where a lot of experienced Emerald Coast investors focus when they enter Cape San Blas for the first time.
Location Tier 3 — Bay-Side and St. Joseph Bay Waterfront
Bay-side properties on St. Joseph Bay offer a genuinely different product for a genuinely different guest. Flat calm water, exceptional fishing, kayaking, paddleboarding, and one of the most biologically rich bay systems in the entire Gulf — this isn’t a consolation prize for guests who couldn’t get a Gulf-front booking. It’s a destination in its own right for the right traveler segment.
ADR benchmarks on bay-side run lower than Gulf-front and Gulf-view — typically in the $300 to $450 range for well-positioned homes — but acquisition costs are also substantially lower, and insurance costs tend to be more manageable. Investors who target the fishing, nature, and eco-tourism segment with proper marketing can build strong occupancy numbers on bay-side properties while carrying a lower debt load.
Location Tier 4 — Interior and Near-Beach Non-Waterfront
Interior properties — those without water views or direct beach access — are the hardest to underwrite as pure STR investments on Cape San Blas. Guests choosing this market over Panama City Beach or 30A are doing so specifically because of the unspoiled natural environment and beach access. A house that doesn’t deliver on that core value proposition competes primarily on price, which compresses ADR and can push occupancy in the wrong direction.
There are exceptions — large homes with exceptional amenities, private pools, or group-friendly layouts can perform in interior positions — but the general rule holds. If you’re buying purely for STR income, stay focused on Tiers 1 through 3.
The Infrastructure Signal Investors Shouldn’t Ignore
The $34.5 million beach nourishment and breakwater project is the single most important near-term development story for Cape San Blas. For a peninsula that has watched erosion impact Gulf-front values over the years, a project of this scale — backed by $24 million in secured grant funding — is a material signal about the long-term viability of the shoreline as a tourism and investment asset.
Projects like this don’t happen in markets that governments have written off. They happen in markets where the economic case for protecting the coastline is clear. Cape San Blas generates real tourism revenue for Gulf County, and this investment reflects that. Buyers closing in 2026 are entering before the full value of that infrastructure improvement is priced into waterfront and near-waterfront inventory.
What to Expect When You Make an Offer in 2026
With DOM running between 119 and 151 days on Cape San Blas residential inventory, the negotiating environment is as buyer-friendly as it’s been since before the pandemic. Sellers who listed 90 to 120 days ago and haven’t closed are paying carrying costs every month. That’s real motivation.
Come in with financing pre-arranged or proof of funds in hand. Know your insurance costs before you submit an offer — get a quote, not an estimate. Understand your flood zone. And have a clear revenue model built on current Key Data market intelligence and realistic occupancy projections, not 2022 peak numbers.
Buyers who do that work before they make an offer are the ones who find the deals that are sitting in plain sight on the Cape San Blas MLS right now.
Frequently Asked Questions
What is a realistic annual gross revenue target for a Cape San Blas vacation rental in 2026?
For a well-positioned Gulf-view or Gulf-front house marketed on both Airbnb and Vrbo, STR analytics data for competitor properties shows annual revenue in the $42,000 to $60,000 range, with peak months generating $9,000 to $9,500 individually. Actual performance varies based on property size, amenities, management quality, and pricing strategy. Our team can build a property-specific projection based on current Key Data market intelligence before you close.
Are short-term rentals legal and unrestricted on Cape San Blas?
As of 2026, Cape San Blas and Gulf County have not imposed the kind of STR restrictions seen in some other Florida coastal markets. Florida’s state preemption framework limits local governments from banning STRs outright in most cases. That said, HOA rules in specific communities can vary — always review any HOA documents and local ordinances with your real estate attorney before closing.
How much does flood and wind insurance cost on Cape San Blas?
It depends heavily on flood zone designation, elevation certificate, year built, and construction type. Gulf-front properties in VE zones can run $15,000 to $25,000 or more annually for combined wind and flood coverage. Gulf-view and interior properties in AE or X zones are typically more manageable. Get an actual insurance quote — not a ballpark — as part of your due diligence before submitting an offer.
Is now a good time to buy on Cape San Blas, or should I wait?
The entry point in August 2026 is materially better than it was in 2021 or 2022. ADR is down 25% from peak per current Key Data market intelligence, days on market are at multi-year highs giving buyers real negotiating power, and acquisition prices have normalized from their peak. The $34.5 million beach nourishment project is an infrastructure tailwind that hasn’t fully priced into the market yet. Waiting for a further correction while that project moves toward completion carries its own risk.
Does Rent & Relax manage properties on Cape San Blas?
Yes. We manage vacation rental properties across Cape San Blas and across Florida’s Emerald Coast including Panama City Beach, 30A, Mexico Beach, and St. George Island. Our Cape San Blas portfolio data feeds directly into the Key Data market intelligence we use to guide investor decisions and set revenue strategies for managed properties.
Ready to Invest in Cape San Blas?
Cape San Blas doesn’t advertise itself the way Panama City Beach does. That’s exactly why the investors who find it tend to move quietly and move well. Extended days on market, normalized pricing, and a $34.5 million infrastructure project in progress — the setup in 2026 is real.
If you want a property-specific revenue projection, a frank conversation about which location tier fits your investment goals, or a walkthrough of what our managed portfolio data actually looks like for Cape San Blas, reach out to the Rent & Relax team. We manage 100-plus properties along the Emerald Coast and we’ll give you straight answers, not a sales pitch.
Contact Rent & Relax Vacation Rentals today to connect with our Cape San Blas investment specialists — or browse our current Cape San Blas property listings and STR management services to see what we’re working with right now.