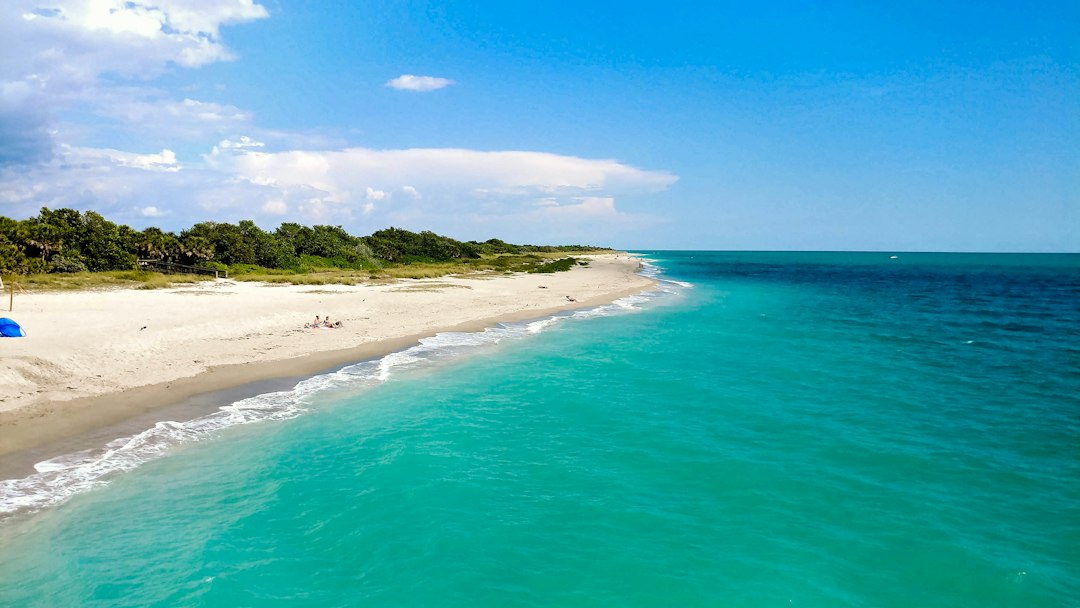
St George Island Best Family-Oriented Investment Areas: 2026 Buyer’s Guide
If you’re researching the st george island best family-oriented investment areas right now, you picked the right time. Homes on St George Island are sitting on the market an average of 85–117 days and selling approximately 6–7% below asking price. On a $1.2 million property, that’s $72,000–$84,000 in negotiating room before you even shake hands. That’s not a distressed market — that’s a repricing cycle that rewards buyers who show up prepared and capitalized.
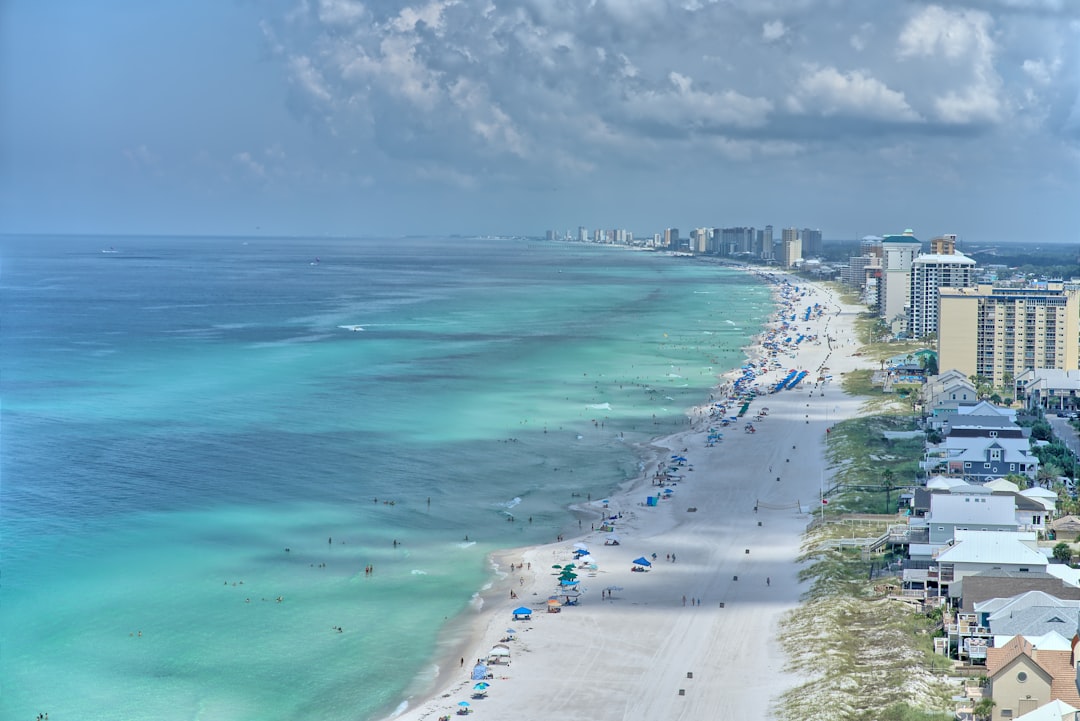
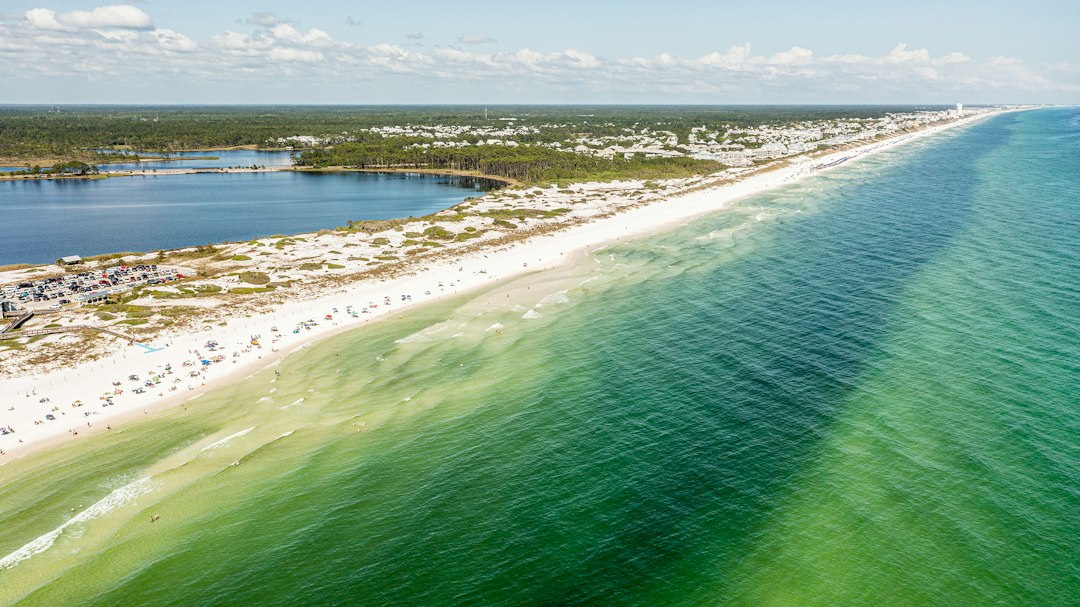
St George Island is a 28-mile barrier island in the Florida Panhandle with no large resort development, no high-rise towers, and a finite land supply. The vacation rental demand here is driven almost entirely by multigenerational family travelers who book early, stay a full week, and come back year after year. The st george island best family-oriented investment areas aren’t scattered randomly across the island — they cluster into three distinct zones, and understanding those zones is the difference between a performing asset and an expensive mistake.
This guide uses current Key Data market intelligence from our managed portfolio, pulled October 2026, alongside independent market research. We’ll cover market conditions, the three investment zones, performance benchmarks, and what an honest underwriting model looks like.
Why St George Island Is a Strong Long-Term Play for Vacation Rental Investors
The Family Travel Demand Driver
St George Island doesn’t attract spring break party crowds or convention travelers. It attracts families — grandparents, parents, and kids booking the same week they booked three years ago. That repeat-visit, multigenerational travel pattern is one of the most durable demand bases a vacation rental market can have.
Peak demand aligns precisely with the family calendar: Memorial Day through July 4th, August vacations, and spring break weeks. According to current Key Data market intelligence (October 2026), the average booking window across our managed properties is 45 days in advance. That’s not someone booking on a Tuesday for the weekend — that’s a family planning ahead, committing early, and budgeting for the trip. Average length of stay across our managed portfolio is 5.2 nights, which tracks closely with weekly rental demand and keeps operational turnover manageable.
Current Market Conditions Favor the Buyer
Here’s the straightforward market picture for St George Island right now:
- Median sale price: approximately $1.175–$1.2 million depending on measurement period
- Homes selling 6–7% below asking price
- Active inventory: approximately 101–117 listings
- Average days on market: 85–117 days
Sellers are waiting. Inventory is elevated relative to current transaction volume. That combination — motivated sellers, longer days on market, and a meaningful discount off list — creates genuine leverage for a buyer who has financing lined up and knows what they’re looking for.
One important note on the price data: St George Island is a low-transaction-volume market. A handful of Gulf-front sales in a quarter can swing the median 20–30% in either direction. One data source shows a trailing 12-month median of $1.175 million, down about 3% year over year. A separate three-month snapshot shows $1.2 million, up 37.7% year over year. Neither number is wrong — they’re measuring different slices of a thin market. When you’re underwriting a specific property, comparable sales by subdivision, Gulf access, bedroom count, pool, and elevation matter far more than island-wide medians.
The bottom line: this is a buyer’s market on a supply-constrained barrier island with a loyal family travel base. That combination doesn’t show up often.
St George Island Best Family-Oriented Investment Areas — The Three Primary Zones
Not every part of St George Island performs equally for family-oriented rental investors. Location determines your nightly rate ceiling, your operating cost structure, your occupancy pattern, and your long-term appreciation profile. Here are the three zones that matter most.
Gulf Beaches and East Gulf Beach Drive — Highest Rate Ceiling, Highest Diligence Requirement
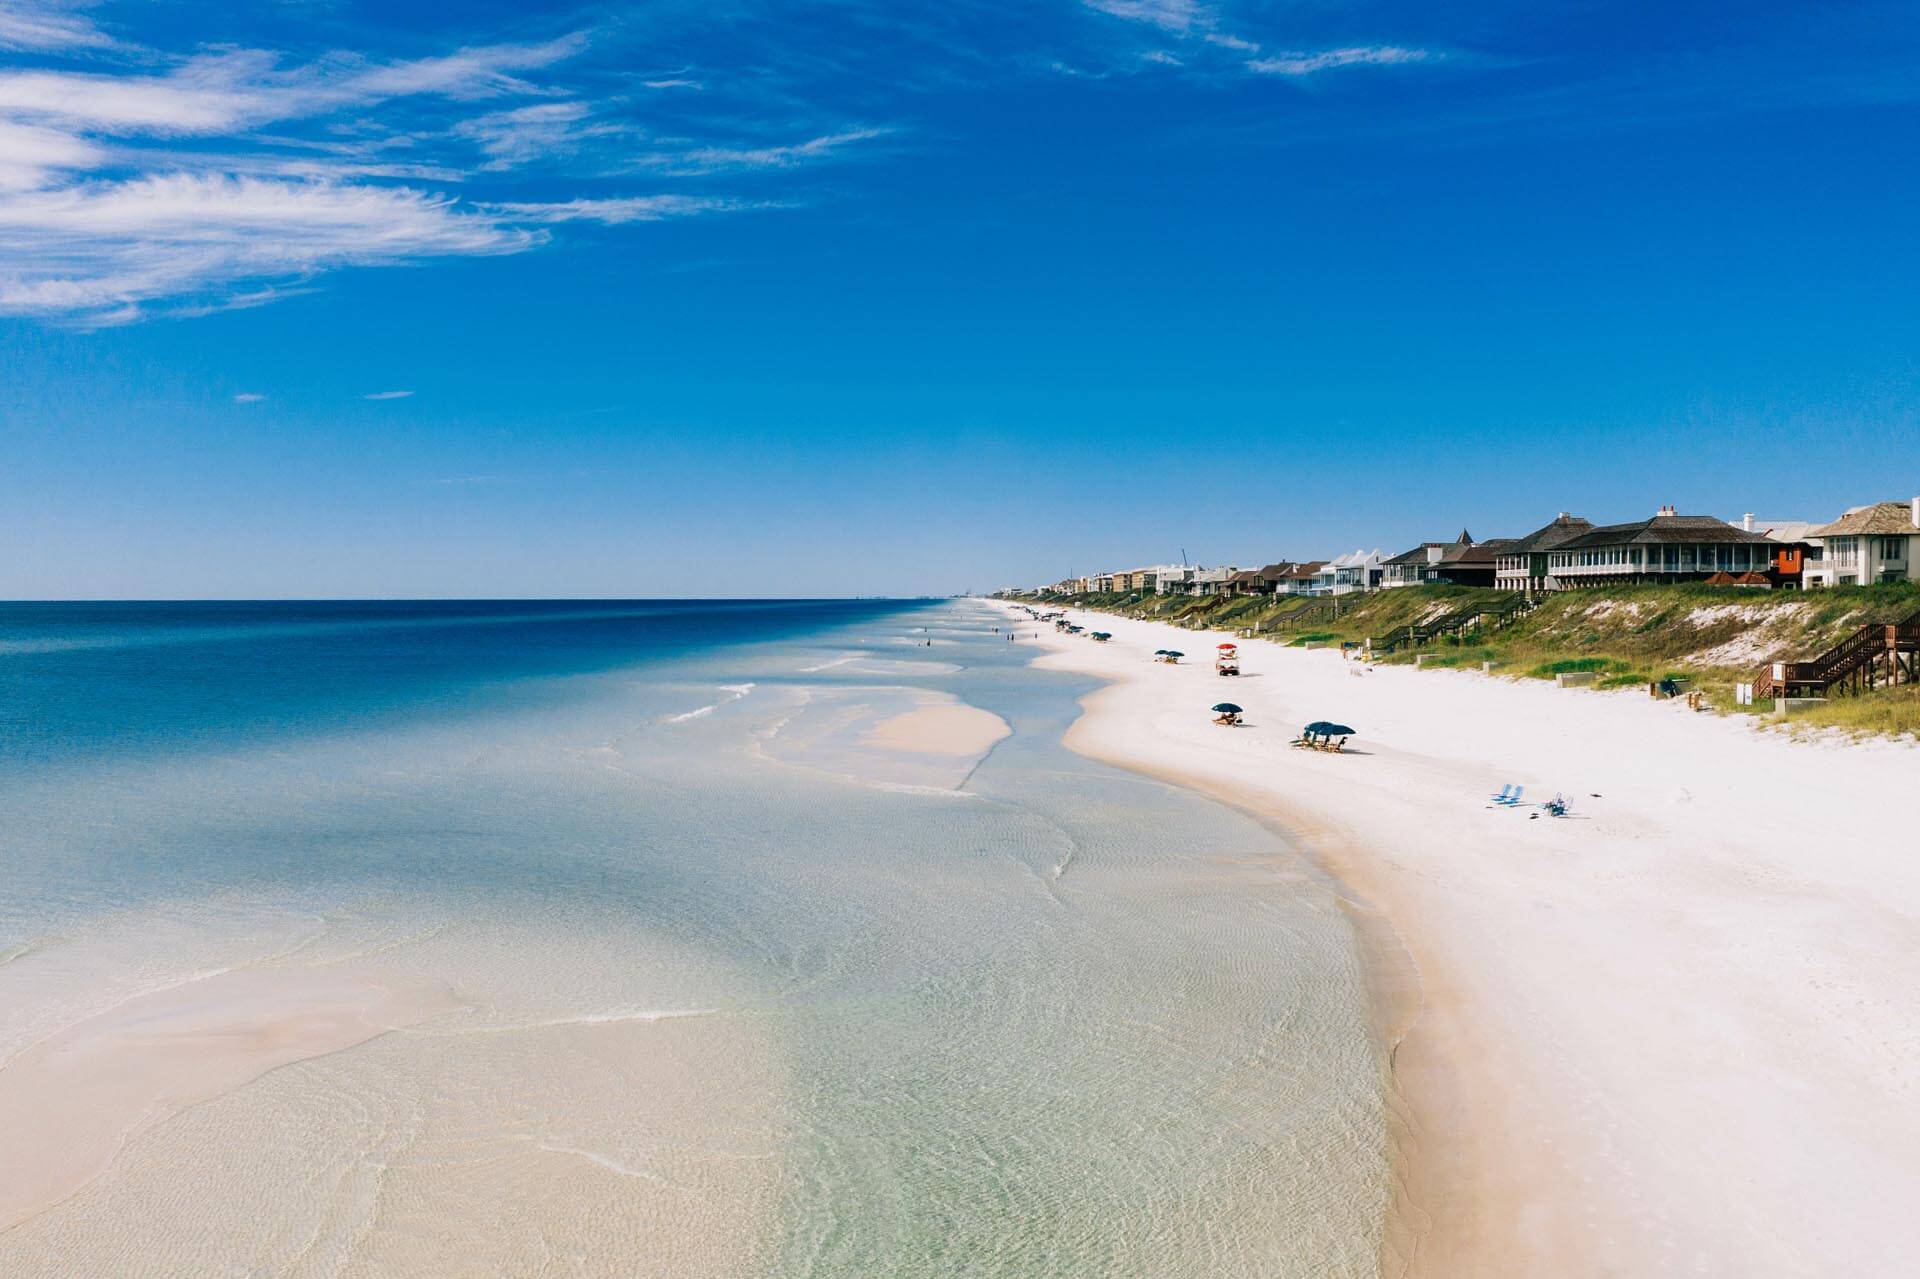
Direct beach access is the single largest driver of family rental premiums on St George Island. Full stop. Families will pay a meaningful weekly premium for a home where they can walk off the deck and be on the Gulf in two minutes. That demand translates into rate power.
Island-level benchmark data shows ADR in the $470–$545 range for comparable properties in this zone. For context, our managed properties across St George Island show an ADR of $307.27 per current Key Data market intelligence (October 2026) — and that figure reflects a specific portfolio mix, not Gulf-front-only properties. The gap between benchmark ADR and our managed portfolio ADR illustrates why property selection within a zone matters as much as zone selection itself. A Gulf-front, five-bedroom home with a private pool and multiple decks is not the same comp as a two-bedroom interior cottage.
The homes that perform in this zone consistently share a profile: four or more bedrooms, private pool, outdoor living space, multiple decks, and enough square footage to sleep an extended family comfortably. Gross annual revenue in the $62,000–$72,000 range is achievable at 36–37% occupancy and $470–$545 ADR, based on independent market benchmarks for the August 2025–July 2026 period.
Now for the honest part. Gulf-front and Gulf-access properties on St George Island carry real operating cost exposure:
- Wind and flood insurance costs are material and rising
- Storm damage reserve requirements are not optional — they’re a business reality
- Elevated replacement costs for beach-adjacent structures
- Beach erosion and access changes over time
- Higher acquisition prices compress your entry yield
Net operating income — not gross revenue — is the correct underwriting metric here. A home generating $70,000 in gross rent that costs $45,000 to operate is not the same deal as a home generating $50,000 in gross rent that costs $20,000 to operate. Build your pro forma from the bottom up.
Best for: Investors with strong equity positions, long-term hold horizons, and tolerance for higher operating cost structures who want maximum rate ceiling and appreciation upside.
St George Plantation — Amenity-Driven Family Appeal in a Gated Setting
The St George Plantation offers something the open-market Gulf Beach properties can’t: a complete family resort environment inside a gated community. Multiple beach access points, community pools, tennis courts, nature trails, and a managed recreational environment. For multigenerational family groups, that package creates a reason to return to the same property year after year — not just to the island, but to that specific rental.
The practical investment advantage is this: Plantation homes don’t need to be Gulf-front to command competitive rates. The amenity environment substitutes for direct beach positioning at a lower acquisition price in many cases. That can improve your entry yield relative to buying a Gulf-front property at peak pricing.
Before you put a Plantation property under contract, work through this diligence checklist completely:
- HOA and association dues — total annual cost, included in your cap rate calculation
- Plantation membership transfer requirements and associated fees
- Amenity assessments — scheduled amounts and timing
- Rental restrictions — some sections of the Plantation limit rental frequency or minimum stays
- Road, gate, and common-area maintenance obligations
- Insurance requirements for older structures — some Plantation homes carry age-related underwriting challenges
The additional association expenses are real carrying costs. A $12,000–$18,000 annual HOA and membership obligation on a $900,000 property changes your yield math significantly. Run the numbers with those costs fully loaded before you fall in love with the property.
Best for: Investors who want family-amenity differentiation, lower price-per-square-foot than Gulf-front, and a built-in community identity that supports repeat bookings and shoulder-season demand.
Bay-Side and Interior Island Locations — Yield-Focused Entry Points
Bay-side and interior properties on St George Island are the yield play. Lower acquisition prices relative to Gulf-front and Plantation properties mean your gross revenue goes further — if you buy right and operate efficiently.
Using the island-level benchmark of approximately $49,847 in gross annual revenue, here’s how the yield math pencils out by acquisition price:
- $1.0 million acquisition: approximately 5.0% gross yield
- $1.2 million acquisition: approximately 4.2% gross yield
- $1.5 million acquisition: approximately 3.3% gross yield
Net yields will be meaningfully lower after management fees, cleaning, utilities, repairs, taxes, insurance, and reserves. But a well-bought interior or bay-side home purchased below the island median has a better chance of delivering positive cash flow than a Gulf-front property carrying $25,000+ in annual insurance and a $1.5 million acquisition price.
The properties in this zone that perform well share a specific set of characteristics: private pool, four or more bedrooms, water views where available, easy beach access (not walking-distance Gulf-front, but a short drive or golf cart ride), pet-friendly policies, pool heating, and flexible minimum stays to capture shoulder-season bookings.
If a bay-side home doesn’t have a private pool and doesn’t have some kind of water view or water access appeal, it’s going to compete on price alone against Gulf-front inventory — and that’s a race to the bottom. Amenities close the gap; bare-bones interior properties don’t.
Best for: Investors prioritizing yield and lower entry price over maximum rate ceiling, who are willing to optimize operations and amenities to drive occupancy.
Underwriting St George Island: What the Numbers Actually Mean
Current Key Data market intelligence (October 2026) for our managed properties on St George Island shows adjusted paid occupancy at 42.9% and ADR at $307.27, producing a RevPAR of $104.45. These figures reflect our specific managed portfolio mix and represent a favorable buyer entry point — properties are available at compressed current performance levels, which means upside for an investor who acquires at today’s pricing and operates at higher performance as the market normalizes.
The island-level benchmark for the August 2025–July 2026 period shows approximately $49,847 in average annual gross revenue at roughly 36.6% occupancy. At $470–$545 ADR, that occupancy rate generates gross room revenue of $62,700–$72,700 before booking exclusions, owner stays, and revenue methodology adjustments explain the difference down to $49,847.
What this means practically: always request 24–36 months of actual booking statements from the seller. Projected rental income figures from listing agents are not a substitute for real performance history. A property that “could earn $80,000 a year” based on comps is not the same thing as a property that has earned $65,000 a year for the last three years with documented statements.
Preliminary cap rate ranges for St George Island, based on independent research:
- Gulf-front, high-cost properties: approximately 2–4% unlevered
- Well-bought family homes with pool and strong occupancy: approximately 4–6%
- Interior or smaller properties purchased below market with documented performance: potentially 6%+
These are estimates for underwriting purposes, not published market-wide statistics. Your specific property, your specific financing, and your specific operating cost structure will determine your actual return.
Frequently Asked Questions
What makes St George Island a good market for family vacation rental investment?
St George Island attracts multigenerational, repeat-visit family travelers who book weeks in advance and stay 5+ nights at a time. That demand pattern supports weekly rental pricing, predictable booking calendars, and lower guest turnover. The island has no large resort development and limited land supply, which supports long-term appreciation. Current market conditions — homes selling 6–7% below list price and sitting on the market 85–117 days — create a genuine buyer entry window that doesn’t come around often on a barrier island this constrained.
Is the St George Plantation a good investment for vacation rentals?
It can be, but the diligence is more involved than a standard purchase. The Plantation’s gated setting, community amenities, and multiple beach access points support family demand and repeat bookings. However, HOA dues, membership transfer fees, amenity assessments, and potential rental restrictions must all be factored into your cap rate calculation before you can evaluate the deal accurately. Don’t buy a Plantation property based on gross revenue projections without fully loading the association cost structure.
What’s a realistic gross yield on a St George Island vacation rental?
Using the island-level benchmark of approximately $49,847 in annual gross revenue, gross yield runs about 5.0% on a $1.0 million acquisition and 4.2% on a $1.2 million acquisition. Gulf-front properties with higher ADR can push gross revenue meaningfully above that benchmark, but they also carry higher operating costs. Net yield — after management, insurance, taxes, cleaning, reserves, and repairs — will be materially lower than gross yield regardless of zone. Underwrite from the bottom up using documented historical performance.
How important is a private pool for St George Island rental performance?
Very important, especially for non-Gulf-front properties. For families booking a week-long vacation, a private pool is often a non-negotiable search filter. Gulf-front homes can sometimes perform without a pool because the beach is the primary amenity. But for Plantation, bay-side, or interior properties, a private pool is typically the difference between competing effectively and sitting vacant during shoulder season. Pool heating extends your bookable season into spring and fall, which directly impacts annual revenue.
Should I ask for historical booking statements before buying a St George Island rental?
Yes, and 24–36 months is the minimum you should request. Projected rental income figures from listing agents reflect optimistic assumptions about occupancy and ADR. Actual booking statements show you what the property has produced in real money, with real guests, under real market conditions. The difference between projected and actual performance is often significant. If a seller can’t produce booking records, that’s an answer in itself.
Ready to Invest in St George Island?
Rent & Relax Vacation Rentals manages 100+ properties along Florida’s Emerald Coast, including St George Island. We know which homes perform, which zones produce the strongest family-rental demand, and what a realistic operating cost structure looks like on the island right now.
If you’re evaluating a St George Island property and want honest numbers — not projected income from a listing sheet — talk to our team. We can walk you through what our managed properties are actually producing, help you identify which zones align with your investment goals, and connect you with the diligence resources you need to underwrite a deal correctly.
Contact Rent & Relax Vacation Rentals today. We’re happy to talk across the table — no corporate pitch, just real data and straight answers.