St George Island Vacation Rental Management Guide: What Owners and Investors Need to Know (2026)
If you’re looking at St George Island as a vacation rental investment right now, here’s the honest picture: median sale prices are running $1.2–$1.23 million, homes are sitting on the market 117–133 days, and buyers are closing at roughly 94 cents on the dollar. That’s not a warning sign — that’s a negotiating environment most buyers haven’t seen on this island in years. This St George Island vacation rental management guide breaks down exactly what the current numbers mean, what you can realistically earn, and how to manage a property here the right way.
We’re pulling from two data sets: current Key Data market intelligence from our Rent & Relax managed portfolio (October 2026 pull) and independent market research covering competitor operators, real estate sales data, and rental benchmarks. No fluff. Just the numbers and what they mean for your investment decision.
Why St George Island Remains a Top Florida Panhandle Vacation Rental Market
Panama City Beach has 27 miles of high-density development. Destin has outlet malls and spring break crowds. St George Island has none of that — and that’s exactly the point.
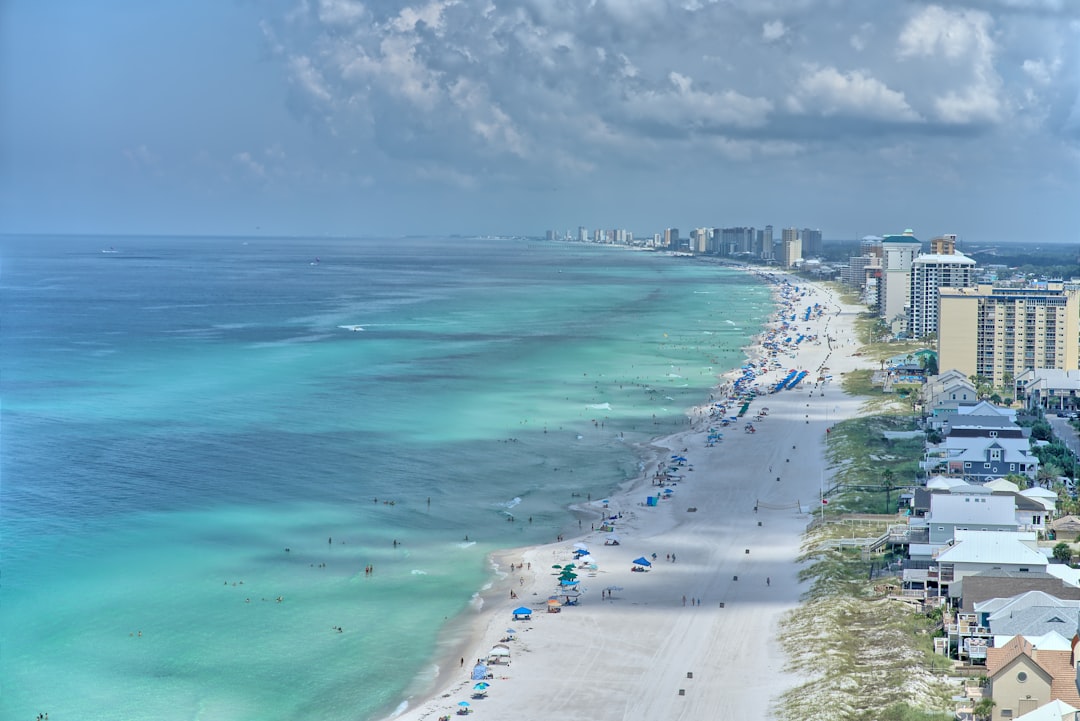
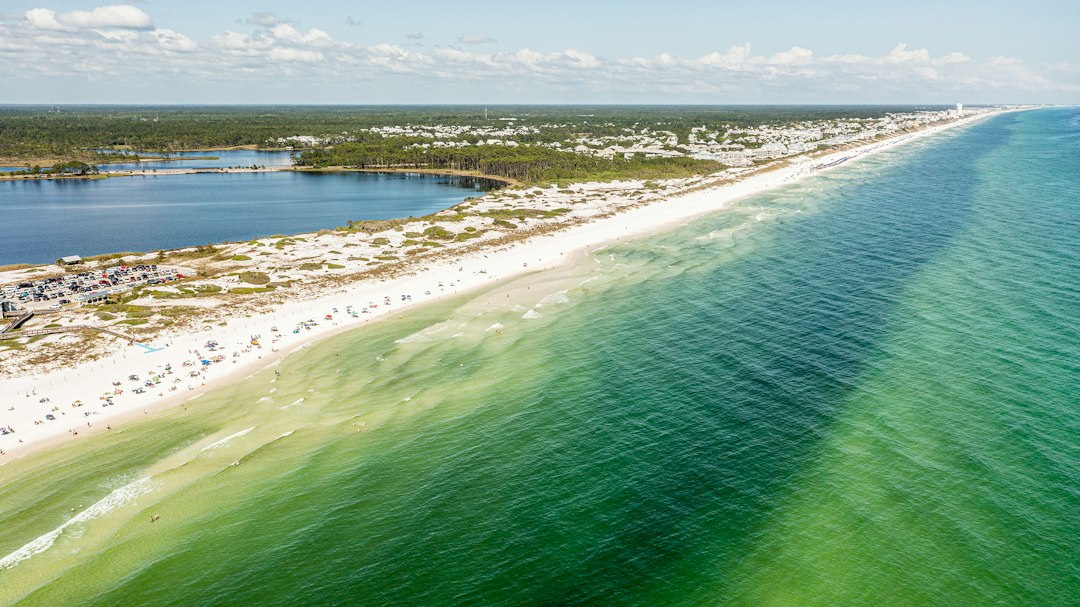
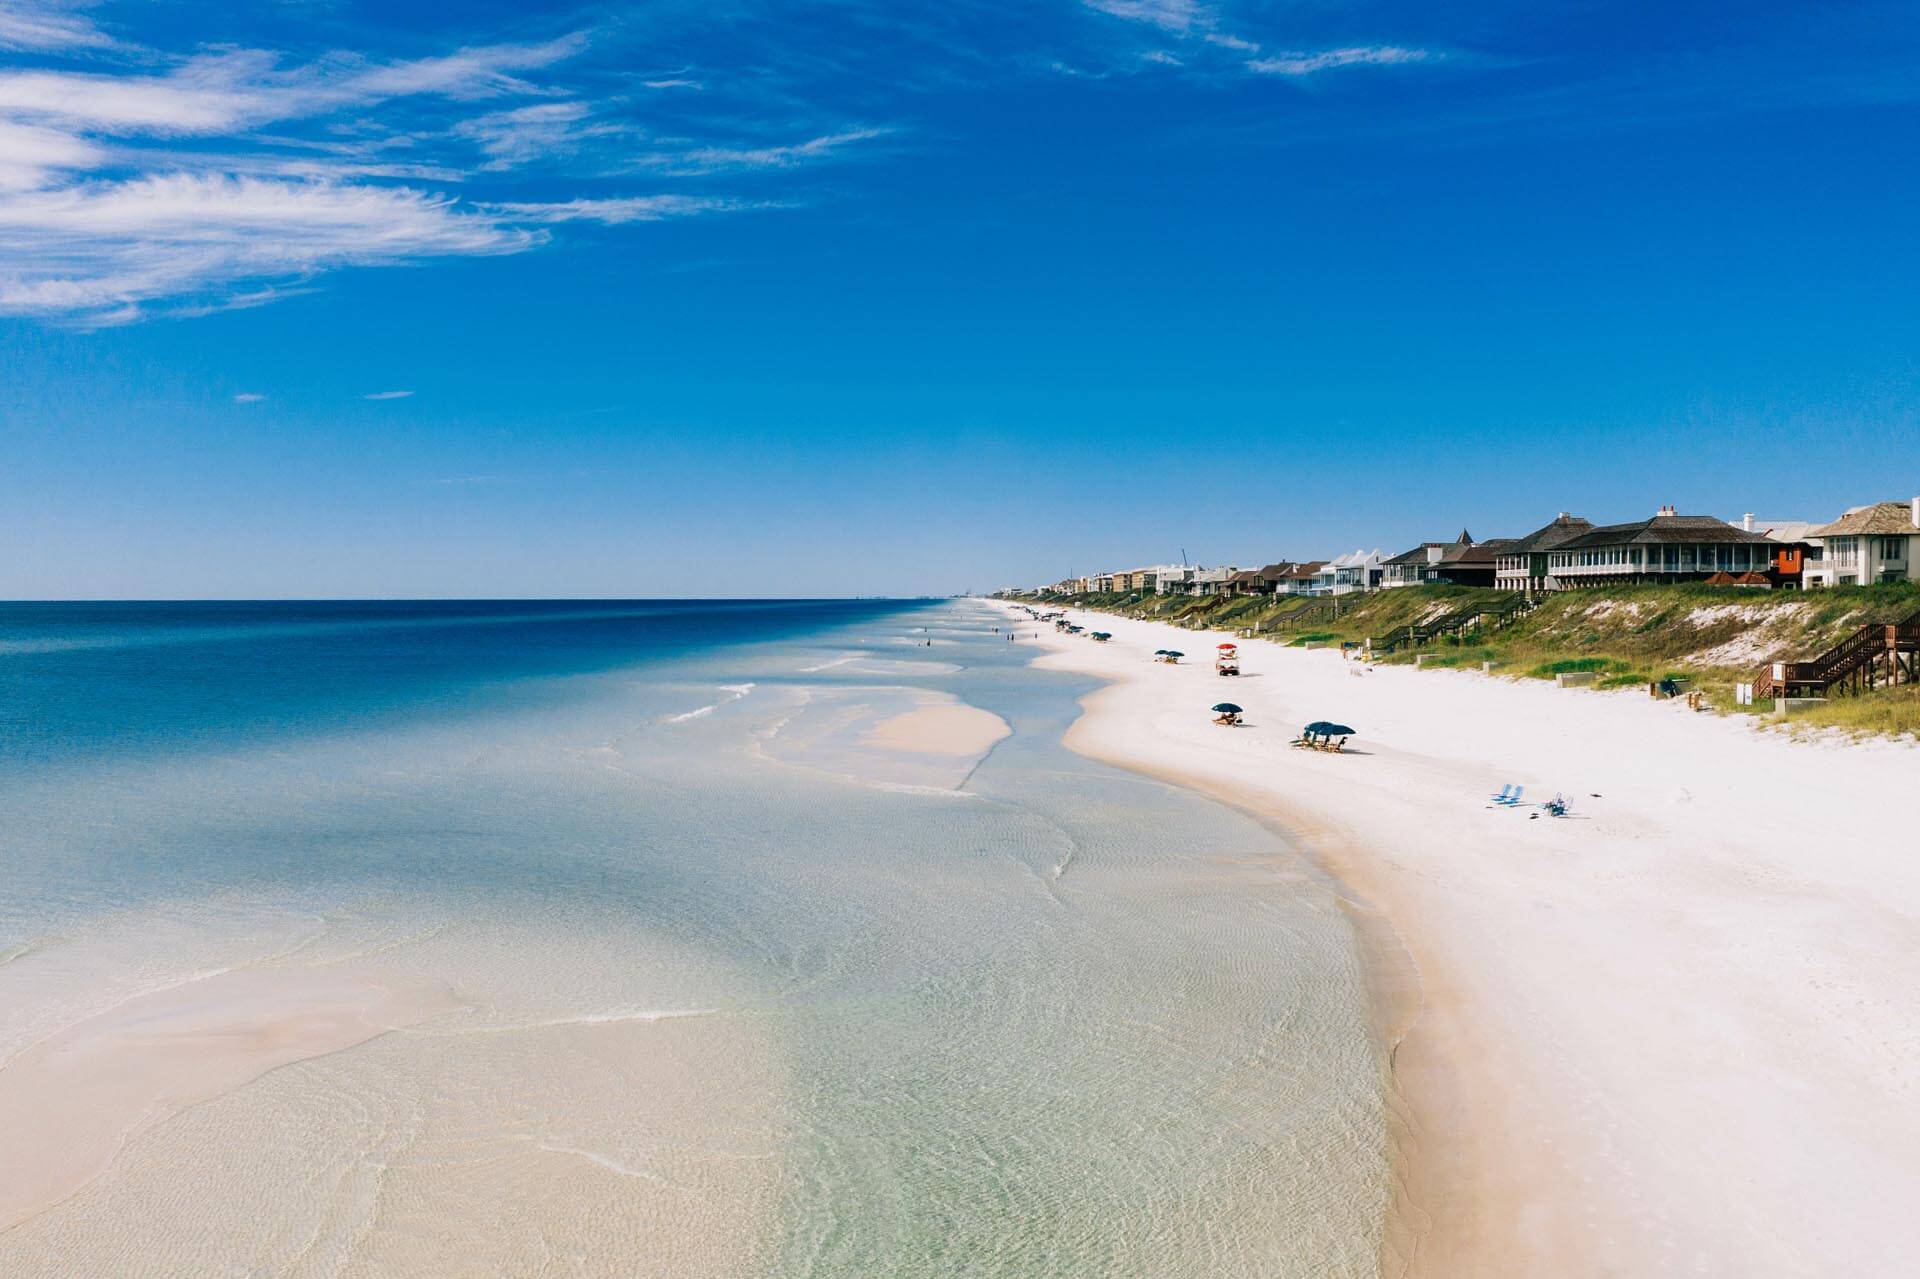
This is a barrier island in Franklin County with a state park at one end, low-density zoning throughout, and no major commercial strip to speak of. The guests who book here aren’t looking for nightlife. They’re booking a St George Island vacation rental because they want a week with their family on one of the least developed stretches of Gulf Coast beach in Florida.
What Makes St George Island Properties Different From Other Gulf Coast Markets
The supply constraint here is real and structural. Coastal permitting, beachfront setbacks, Franklin County regulations, and septic limitations mean new construction is genuinely limited. You’re not going to see a 200-unit condo tower break ground on St George Island. That supply ceiling supports long-term asset values in a way that more developed markets simply can’t replicate.
The two dominant property management operators — Collins Vacation Rentals (275–280 homes) and Resort Vacation Properties, now owned by Vacasa (300+ homes) — together manage a substantial share of the island’s rental inventory. That’s a concentrated market, which means individual property performance is heavily influenced by how well each home is positioned, priced, and managed.
Before you purchase, verify these items with a local agent and Franklin County directly: county short-term rental rules, flood zone and elevation requirements, coastal construction permits, beachfront setback restrictions, septic or wastewater limitations, and any HOA or community restrictions. Don’t assume. Confirm.
Who Is Buying and Renting on St George Island Right Now
The renter profile here skews heavily toward families — multigenerational groups booking 4- and 5-bedroom homes for reunion trips, couples doing nature-focused getaways, and repeat visitors who’ve been coming back to the same island for years. This isn’t a transient crowd. Guest loyalty on St George Island is genuinely high.
On the buyer side, you’ve got two profiles: the second-home buyer who wants personal use with some income offset, and the buy-and-hold investor comfortable riding market cycles in exchange for appreciation and a solid vacation asset.
From our Rent & Relax managed portfolio, current Key Data market intelligence (October 2026) shows an average booking window of 45 days in advance. Guests aren’t impulse-booking — they’re planning ahead. That matters for revenue predictability and for setting your pricing calendar early. The same data shows an average length of stay of 5.2 nights. Longer stays mean fewer turnovers, fewer cleaning cycles, and lower operational friction per booking. That’s a real cost advantage compared to markets dominated by weekend stays.
Understanding the St George Island Real Estate Market Before You Invest
Any honest St George Island vacation rental management guide has to start with the real estate picture, because the purchase price is the foundation of every return calculation. Here’s what the data actually shows.
Current Sale Prices, Inventory, and Days on Market
Two sources, two slightly different numbers — both worth understanding. Redfin puts the median sale price at $1.2 million based on the three months ending August 2026. Homes.com reports $1.23 million over a trailing 12-month window and notes no year-over-year change. The difference comes down to time window and methodology, not data error. For underwriting purposes, use $1.2–$1.23 million as your headline range and then adjust based on the specific property’s location, beach access, pool, construction age, and rental history.
Price per square foot is running approximately $574–$576 based on Movoto and Realtor.com data. Homes are selling in 117–133 days, up from 108 days a year earlier. That extended time on market gives informed buyers more room to conduct thorough due diligence — and more room to negotiate. The sale-to-list ratio of approximately 94% means homes are closing at roughly 6% below asking price on average as of September 2026. On a $1.2 million home, that’s $72,000 in negotiating room. That’s real money.
Inventory in the broader 32328 ZIP code jumped from 103 listings in June 2025 to 261 listings by May 2026 — a 153.4% increase. Approximately 75 price reductions are active, and there are no reported foreclosures or short sales. One important caveat: the 32328 ZIP code includes Eastpoint on the mainland and is not island-only data. Use island-specific sales history and a local agent for precise underwriting. Don’t rely on ZIP-code-level averages to make a seven-figure decision.
How to Read a Cap Rate at St George Island Price Points
Independent market research estimates annual gross rental revenue at approximately $49,847 per listing on St George Island, with an ADR benchmark around $520 per night across the broader market. At a $1.2 million purchase price, that gives you a gross revenue yield of about 4.15% — and that’s before a single operating expense.
Here’s the honest cap rate picture using two illustrative expense scenarios:
- At a 35% operating expense ratio: estimated NOI of $32,400, indicated cap rate of approximately 2.7%
- At a 45% operating expense ratio: estimated NOI of $27,400, indicated cap rate of approximately 2.3%
- At $75,000 gross revenue and 35% expenses: NOI of $48,750, cap rate of approximately 4.1%
- At $100,000 gross revenue and 35% expenses: NOI of $65,000, cap rate of approximately 5.4%
These are underwriting illustrations — not guaranteed outcomes and not reported market cap rates. The point is straightforward: at current island prices, pure cash-flow returns are tight unless you’re buying below market, achieving above-average rental revenue, or factoring in personal use and long-term appreciation as part of your total return thesis. Get at least 24 months of monthly booking statements from any property with existing rental history before you close.
St George Island Rental Performance Benchmarks: What Our Data Actually Shows
Here’s where the St George Island vacation rental management picture gets specific. Our current Key Data market intelligence from the Rent & Relax managed portfolio (October 2026 pull) gives you a ground-level view of how properties are actually performing right now — not what a listing portal estimates.
Our Managed Portfolio Performance (Key Data, October 2026)
Four numbers every buyer and investor should know:
- Average Daily Rate (ADR): $307.69 — down 19.9% from the prior year. For buyers entering the market now, this rate compression is a favorable entry point. You’re buying into a market where rates have already adjusted, which means your revenue projections are grounded in current reality rather than peak-cycle assumptions.
- Adjusted Paid Occupancy: 42.8% — down 15.3% from the prior year. Same read: this is the market having already corrected. Buyers who purchase at current prices and ADR levels are underwriting on a more conservative base than anyone who bought at 2022 peak figures.
- RevPAR: $104.40 — revenue per available room-night across our managed portfolio. This is your operational efficiency benchmark.
- Average Booking Window: 45 days — guests are planning ahead, not booking last-minute. This gives property managers a meaningful window to optimize pricing before each stay.
- Average Length of Stay: 5.2 nights — again, longer stays reduce your per-booking cleaning costs and turnover time. That’s operational margin you keep.
The gap between the Key Data portfolio ADR of $307.69 and the broader market benchmark ADR of approximately $520 reflects differences in property mix, size, amenities, and management approach. Larger homes with pools and direct beach access command premium rates. Smaller properties or those farther from the beach perform closer to the portfolio average. Know which category your target property falls into before projecting income.
What Good St George Island Property Management Actually Looks Like
Managing a vacation rental on St George Island isn’t the same as managing one in Panama City Beach or on 30A. The guest expectations, the property types, and the operational realities are different.
Pricing Strategy for a Seasonal Market
St George Island has real seasonality. Summer school-holiday weeks and spring break periods are your revenue anchors. Shoulder-season weekends — particularly fall — drive meaningful bookings from nature travelers and retirees. Winter demand is softer, but it exists. A 45-day average booking window means you have time to use dynamic pricing effectively if you’re adjusting rates proactively rather than setting a flat weekly rate and walking away.
Don’t leave money on the table during peak weeks by under-pricing, and don’t panic-discount in the shoulder season before you’ve tested the demand. The 5.2-night average stay tells you guests are willing to commit — price accordingly.
Operations, Maintenance, and Guest Experience
Island logistics matter here more than in most markets. Contractors, cleaning crews, and maintenance vendors serving St George Island are operating with limited capacity. Build relationships before you need them urgently. A maintenance issue on a Saturday in July that takes four days to resolve because you don’t have a reliable local vendor will cost you in reviews and rebooking.
Repeat guest loyalty on St George Island is genuinely high. Invest in the guest experience — quality linens, well-stocked kitchens, accurate listing photos, and honest property descriptions. Guests who’ve been coming to the island for 10 years know what a good rental looks like. Meet that standard and you’ll see repeat bookings. Miss it and they’ll find another property for next summer.
Frequently Asked Questions
How much can I realistically earn from a St George Island vacation rental?
Independent market research estimates average annual gross revenue of approximately $49,847 per listing island-wide. Our current Key Data market intelligence (October 2026) shows an ADR of $307.69 and adjusted paid occupancy of 42.8% across our managed portfolio. Individual property performance depends heavily on size, beach access, pool, amenities, and how aggressively the property is priced and marketed. Larger homes with pools and gulf views routinely outperform the portfolio average. Request 24 months of actual booking statements from any property with rental history before projecting your own income.
Is now a good time to buy a St George Island investment property?
The data points toward yes for buyers who do their homework. Homes are taking 117–133 days to sell, the sale-to-list ratio is approximately 94%, inventory has increased substantially, and ADR and occupancy have already corrected from prior-year peaks. You’re entering at a point where the market has reset — not at the top of a cycle. That said, cap rates at current price points are tight on a pure cash-flow basis, so your return thesis needs to account for appreciation, personal use, or above-average revenue performance.
What are the biggest regulatory risks for St George Island vacation rental owners?
Franklin County governs short-term rentals on St George Island as an unincorporated community. Before purchasing, verify county short-term rental rules, flood zone and elevation certificate requirements, coastal construction permit history, beachfront setback compliance, septic or wastewater system limitations, and any HOA or community restrictions on rental use. These are not formalities — they are material to whether a property can legally operate as a short-term rental and at what capacity.
How does St George Island compare to 30A or Panama City Beach as a vacation rental investment?
St George Island offers lower density, structural supply constraints due to coastal permitting and Franklin County regulations, and a guest profile that skews toward longer stays and repeat visitors. The trade-off is a smaller overall demand pool compared to 30A’s 26-mile corridor or Panama City Beach’s massive tourist volume. St George Island tends to reward investors who manage well and build guest loyalty rather than those relying on high transient volume.
What should I look for in a St George Island property management company?
Start with data transparency. Any management company worth working with should be able to show you current ADR, occupancy, and RevPAR benchmarks for their managed portfolio — not just testimonials and glossy brochures. Ask specifically about their dynamic pricing approach, vendor relationships on the island, guest communication standards, and how they handle maintenance during peak season. Local presence and island-specific experience matter here in ways that national operators often can’t match.
Ready to Invest in St George Island?
Rent & Relax Vacation Rentals manages 100+ vacation rentals along Florida’s Emerald Coast, and we know the St George Island market from the ground up. If you’re evaluating a purchase or already own a property and want to know what it’s actually worth as a rental, let’s talk through the numbers together — no sales pitch, just real data and honest advice.
Contact our team today to get a rental income projection for a specific property, review current Key Data market intelligence for St George Island, or learn how our management approach stacks up against the other operators on the island. We’re here when you’re ready to have that conversation.