Cape San Blas Top Mistakes Investors Make: What the Data Really Shows Before You Buy
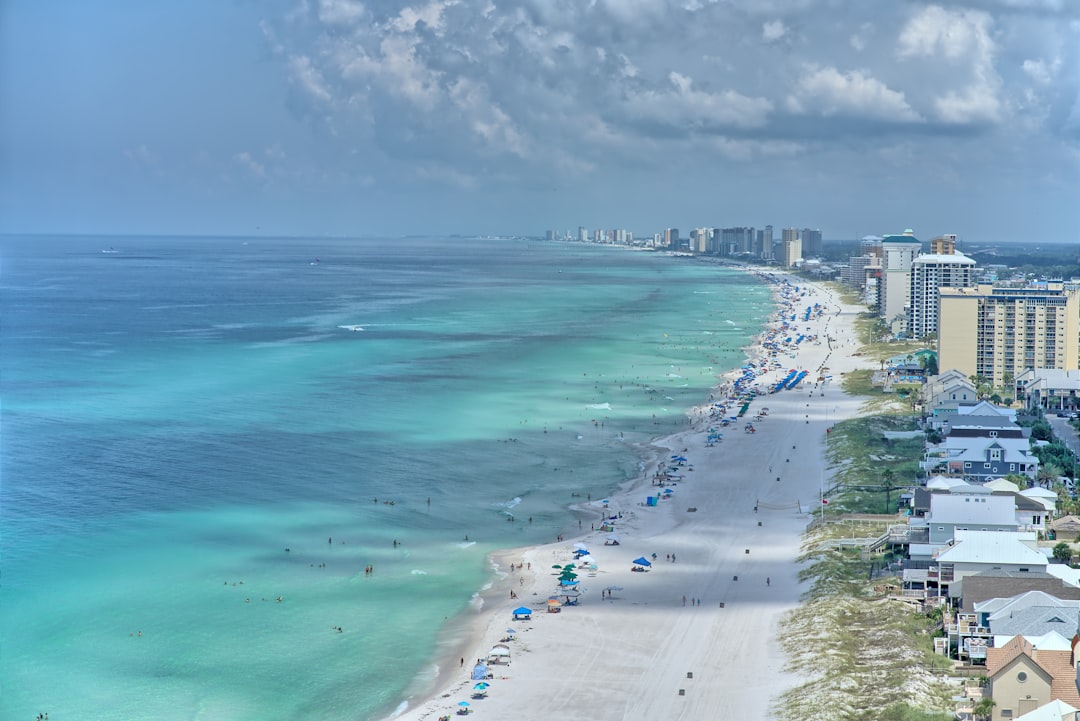
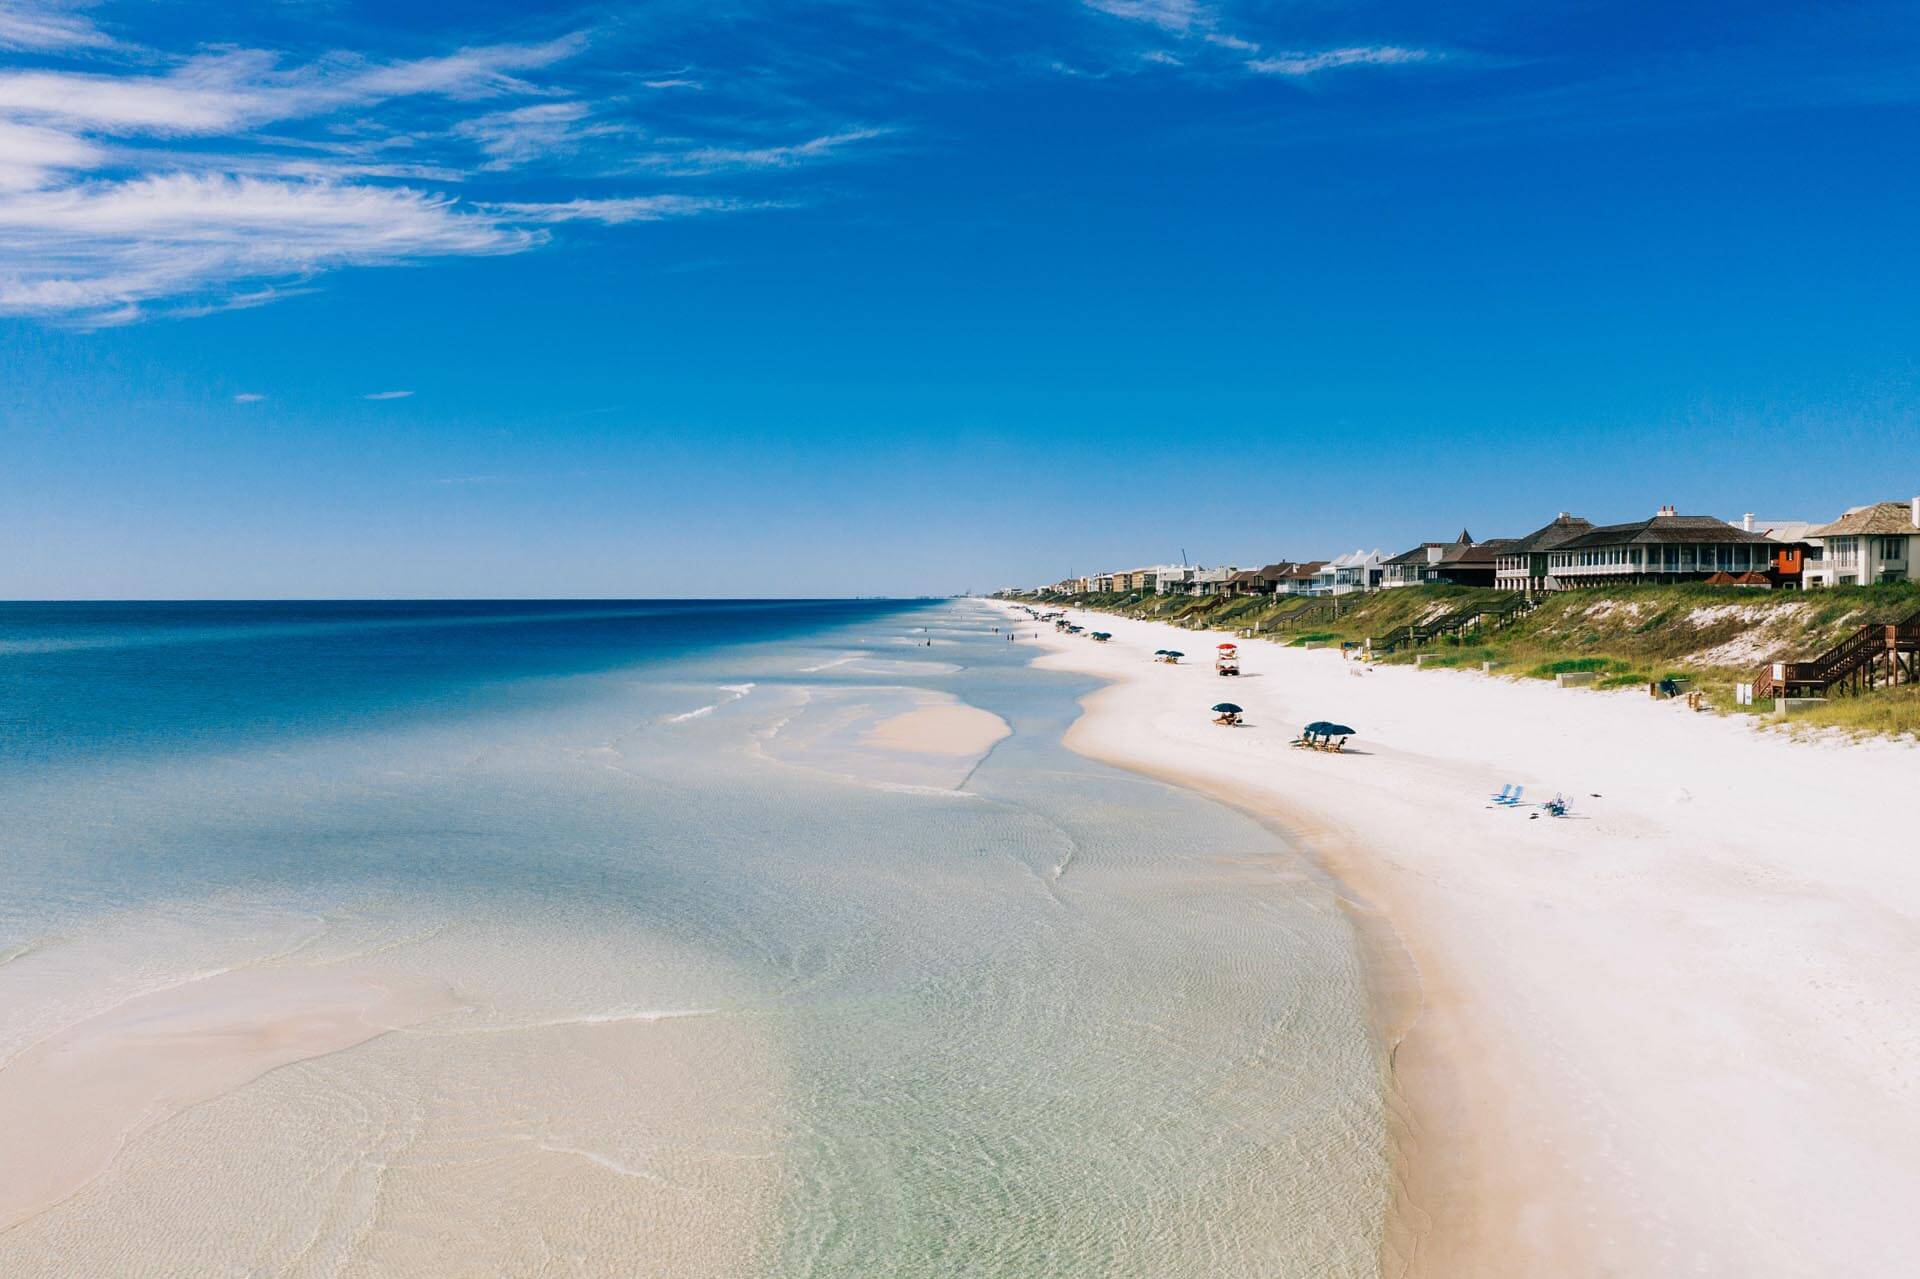
Cape San Blas stops people in their tracks. Sugar-white sand, Gulf-front lots, no high-rises, no chain restaurants — just one of the most pristine stretches of coastline left in Florida. Vacation rental platforms show eye-catching ADR figures, and it’s easy to pull up a listing at $900,000 and start running mental math on what that property could earn.
But here’s the thing: the gap between a glossy property listing and a real return on a $900,000+ purchase is wider than most buyers realize. The cape san blas top mistakes investors make aren’t obvious — and they’re not unique to first-timers. We see experienced buyers fall into the same traps repeatedly. Current Key Data market intelligence from our managed properties (September 2026 pull) shows an adjusted paid occupancy of 44.9% and an ADR of $304.02 — both down from the prior year. That’s not a reason to walk away. It’s a favorable buyer entry point. But only if you buy right and go in with clear eyes.
That’s what this post is about. We’re going to walk through five critical mistakes investors make in the Cape San Blas vacation rental market — and back every single point with real numbers, not marketing estimates.
Mistake #1 — Trusting Headline Occupancy Numbers Without Understanding the Methodology
This is the most dangerous data trap in Cape San Blas investing, and it catches buyers at every experience level.
The Occupancy Number You See vs. the Occupancy Number That Pays Your Mortgage
Not all occupancy numbers are measuring the same thing — and the difference matters enormously when you’re underwriting a $900,000 purchase.
Market-wide competitor data from AirDNA and AirROI shows Cape San Blas Airbnb-only occupancy sitting around 32–33% annually across approximately 87 active Airbnb listings, with average annual revenue per unit of about $42,133. Blended Airbnb plus Vrbo occupancy across the full Cape San Blas STR market runs higher — around 50–54% annually — but that figure uses a combined available-nights methodology that smooths over platform-specific gaps.
Here’s the mistake buyers make: they see the 50–54% blended figure, drop it into a pro forma, and never realize their individual unit may perform closer to the low-30s% range depending on platform mix, property type, bedroom count, and how the property is managed. That’s a massive difference when you’re trying to service debt on a $1M acquisition.
What Our Managed Portfolio Data Actually Shows
Current Key Data market intelligence from our managed properties (September 2026 pull) shows adjusted paid occupancy of 44.9%, down 9.6% from the prior year. We’re not hiding that number — we’re putting it front and center because it tells you something important: softened occupancy in Cape San Blas right now creates a window for buyers who do their homework. Acquisition prices have room, and well-managed properties entering the market today can capture market share as conditions stabilize.
RevPAR across our managed Cape San Blas portfolio is $106.47. That’s the number buyers should be benchmarking against — not raw occupancy percentages pulled from aggregator dashboards that blend premium Gulf-front homes with interior lots and older non-vacation-ready product.
When you’re talking to a prospective property manager, ask them for their actual adjusted paid occupancy figure from a verified data source. If they can’t give you one, that tells you something.
Cape San Blas Is a Seasonal Market, Not a Beach Hotel
Competitor market data shows peak months — June, July, and March — generating roughly 50% occupancy at approximately $575 ADR. That’s strong performance. But January, November, and December compress to around 22.8% occupancy, even though ADR stays relatively elevated at about $513.
Buyers who model a flat 60–70% annual occupancy rate are treating Cape San Blas like a year-round urban rental market. It isn’t. Cape San Blas success looks like high ADR, long stays (our managed properties average 5.2 nights per booking), and a short but intense peak window. Your pro forma has to reflect that reality — not the one you’d build for a condo near a major convention center.
Mistake #2 — Underestimating What a Cape San Blas Investment Property Actually Costs
Many buyers come into the Cape San Blas real estate market anchored to portal median prices. They budget accordingly — and then discover the actual investor-grade product trades in a completely different price band.
Portal Medians vs. MLS Investor Reality
Realtor.com and similar portals report a blended Cape San Blas median home price ranging from $438,850 to $525,000 depending on the snapshot. Those figures blend interior lots, non-Gulf-facing product, properties pulling from the broader Gulf County data feed, and smaller homes that aren’t vacation-rental-ready.
MLS data focused specifically on Cape San Blas vacation rental investment product tells a very different story. The average residential sale price in 2025 was approximately $1,034,278. The median was approximately $821,000, down slightly from about $870,000 in 2024. True investor-grade Cape San Blas vacation homes are transacting in the $800,000 to $1.1M+ range. If you show up budgeting $550,000 expecting a Gulf-front rental, you’re going to be shopping in a completely different market than you expected.
The Carrying Cost Calculation Buyers Routinely Miss
At an $821,000 to $1,034,000 purchase price, the carrying costs stack up fast — and most buyers don’t model them accurately.
You need to account for flood insurance, which is mandatory in most Gulf-front zones and has risen significantly following post-2023 insurance market shifts in Florida. Wind and hazard insurance on the Florida Panhandle runs among the highest premiums in the state. Add HOA fees where applicable, property management fees that typically run 20–35% of gross rental revenue in this market, maintenance reserves specific to saltwater and coastal exposure, and ongoing furniture and fixture replacement cycles that run faster at the beach than anywhere inland.
Now anchor that against the revenue reality. Market-wide competitor data shows the average Cape San Blas Airbnb generating about $42,133 in annual gross revenue at roughly 32.4% occupancy and $566 ADR. Strip out management fees, insurance, property taxes, HOA, and maintenance — and the net operating income on a $900,000+ purchase can look a lot thinner than the headline gross figure suggested. Run the full math before you make an offer.
Mistake #3 — Ignoring Days on Market and What It Signals About Exit Strategy
Cape San Blas is not a liquid market right now. Buyers who don’t understand that going in can find themselves holding a property longer than they planned if life circumstances change.
The DOM Story No One Is Telling You
In 2022, the average days on market for a Cape San Blas residential listing was 36 days. By 2024, that number had climbed to 107 days. Current data shows average DOM running 119 to 151 days depending on the source — that’s nearly a quadrupling in three years.
Inventory tells the same story. In early 2023, the Cape San Blas and Indian Pass corridor had approximately 35 homes and 90 lots listed. By the beginning of 2024, that had grown to 80 homes and 97 lots. By August 2024, listings had reached 149 homes and 130 lots. The market has more supply and slower velocity than it’s had at any point in recent memory.
For a buyer, this is actually useful information — it gives you negotiating leverage and a favorable entry point. But you need to go in understanding that if you need to exit quickly, Cape San Blas isn’t going to give you a 30-day turnaround. Plan your hold period accordingly.
Mistake #4 — Overlooking Coastal Engineering and Infrastructure Dynamics
Cape San Blas is a barrier peninsula. The coastline moves. Buyers who treat Gulf-front property like a static asset without understanding coastal engineering dynamics are setting themselves up for expensive surprises.
The $40M Beach Project Buyers Need to Know About
Cape San Blas is currently in the middle of a major beach nourishment and coastal structures project. Over $40 million has been invested to rebuild and protect approximately one mile of shoreline using imported sand and engineered rock features — specifically submerged breakwaters. Construction began around December 2025 and ran into spring 2026, with Gulf County adding approximately 830,000 cubic yards of sand and eight submerged breakwaters.
This is not a negative for the market — it’s a significant public investment in protecting Cape San Blas’s most valuable asset. But buyers need to understand it. Where is the project focused? Which parcels benefit most from the new breakwater positioning? Are there construction access easements affecting specific lots? These are questions you need answered before closing, not after.
The investors who ignore coastal engineering are the ones who buy a Gulf-front lot and discover three years later that the shoreline has shifted in a way that affects their rental appeal or their flood zone designation.
Mistake #5 — Choosing a Property Manager Based on Fees Instead of Performance
Cape San Blas vacation rental investment success lives and dies on management execution. The Cape is remote. It’s not a market where a part-time manager juggling 10 properties is going to maximize your revenue. Buyers who optimize for the lowest management fee percentage often end up with the worst net returns.
What Management Quality Actually Moves
Our managed properties carry an average booking window of 45 days — meaning guests are booking about six weeks out. That number matters because it tells you how much runway your manager has to fill gaps, adjust pricing, and push shoulder-season demand. A manager who isn’t actively working that 45-day window is leaving money on the table.
Current Key Data market intelligence from our managed Cape San Blas properties (September 2026 pull) shows an average length of stay of 5.2 nights. That’s a longer-stay guest profile — which is great for Cape San Blas because it reduces turnover costs and cleaning overhead. But it means your manager needs to be skilled at pricing longer-stay blocks correctly, not just chasing nightly ADR.
The difference between a mediocre manager and a strong one in this market can easily be $10,000–$20,000 in annual gross revenue on a typical Cape property. That’s not a rounding error on a $1M purchase — that’s the difference between a deal that works and one that doesn’t.
Frequently Asked Questions
What is the realistic annual revenue for a Cape San Blas vacation rental?
Market-wide competitor data shows the average Cape San Blas Airbnb generating approximately $42,133 in annual gross revenue at about 32.4% occupancy and $566 ADR. Well-run properties in peak months can generate $9,300–$9,500 in a single month. Current Key Data market intelligence from our managed properties (September 2026 pull) shows a RevPAR of $106.47 and adjusted paid occupancy of 44.9% — a useful benchmark for any serious buyer running a pro forma.
Are Cape San Blas home prices still rising?
Not dramatically. The MLS median for investor-grade Cape San Blas vacation homes came in at approximately $821,000 in 2025, down from about $870,000 in 2024. Average days on market have stretched to 119–151 days. That combination — softening prices and slower sales velocity — means buyers currently have more negotiating leverage than they’ve had in several years. That’s a favorable entry point for buyers who are prepared.
What occupancy rate should I use when modeling a Cape San Blas investment?
Do not use flat annual occupancy figures without understanding the methodology behind them. Blended Airbnb plus Vrbo market-wide occupancy sits around 50–54%, but Airbnb-only occupancy for competitor listings is closer to 32–33%. Our managed portfolio shows adjusted paid occupancy of 44.9% per current Key Data market intelligence (September 2026 pull). Use that adjusted paid occupancy figure — not blended platform numbers — as your conservative baseline, and model seasonality: peak months at approximately 50% occupancy and $575 ADR, off-season months at roughly 22–23% occupancy.
How does the Cape San Blas beach renourishment project affect property values?
The ongoing $40M+ beach nourishment and breakwater project is a net positive for properties in the affected corridor — it represents a significant public investment in protecting the shoreline that drives rental demand. But buyers need to understand exactly which parcels are closest to the new breakwater structures, whether any construction easements affect specific lots, and how the project may affect flood zone mapping going forward. Ask these questions before you make an offer.
What should I look for in a Cape San Blas property manager?
Ask for their verified adjusted paid occupancy figures from a data source like Key Data — not a marketing estimate. Ask about their average booking window and how they manage pricing in the 45-day-out window. Ask how many Cape San Blas properties they manage and what their average length of stay is. Management quality is one of the highest-leverage decisions you’ll make in this market. Don’t choose on fee percentage alone.
Ready to Invest in Cape San Blas? Talk to a Team That Knows the Numbers.
Rent & Relax Vacation Rentals manages 100+ properties along Florida’s Emerald Coast, including Cape San Blas. We pull current Key Data market intelligence every month. We know what properties in this market actually earn — not what platforms say they earn.
If you’re serious about buying a Cape San Blas vacation rental, let’s sit down and run the real numbers together before you sign anything. We’ll show you our actual portfolio performance, walk you through carrying costs, and tell you exactly what to look for — and what to avoid — in this market right now.
Contact Rent & Relax Vacation Rentals today and talk to someone who manages Cape San Blas properties for a living — not someone who just sells them.